Fig. 1.
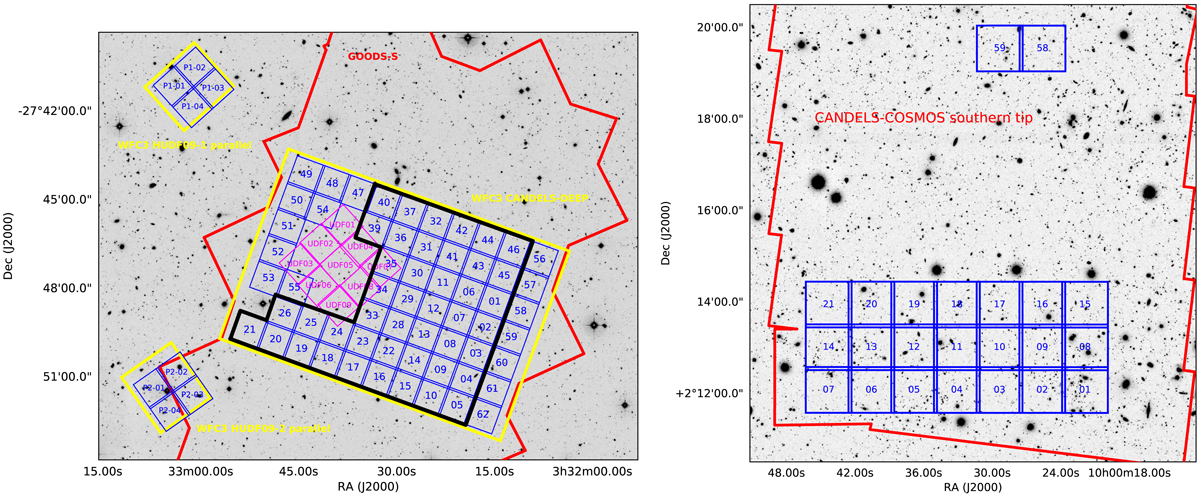
Layout of the 91 fields observed for the MUSE-Wide survey in blue. Left: footprint in the Chandra Deep-Field South region overlaid on the V-Band image from the Garching-Bonn Deep Survey (GaBoDS; Hildebrandt et al. 2006). Shown in red are the approximate contours of the GOODS-S ACS and in yellow of the CANDELS-DEEP and HUDF09 parallels WFC3 regions. The magenta regions represent the nine MUSE-Deep intermediate depth mosaic of the HUDF. The current data release encompasses the fields enclosed by the thick black line. Right: footprint in the COSMOS region overlaid on the SUBARU-COSMOS i’-Band image (Taniguchi et al. 2007) available from IRSA (http://irsa.ipac.caltech.edu/Missions/cosmos.html). The red contours denote the southern tip of the deep HST exposures in the CANDELS-COSMOS region.
Current usage metrics show cumulative count of Article Views (full-text article views including HTML views, PDF and ePub downloads, according to the available data) and Abstracts Views on Vision4Press platform.
Data correspond to usage on the plateform after 2015. The current usage metrics is available 48-96 hours after online publication and is updated daily on week days.
Initial download of the metrics may take a while.