Free Access
Fig. 8.
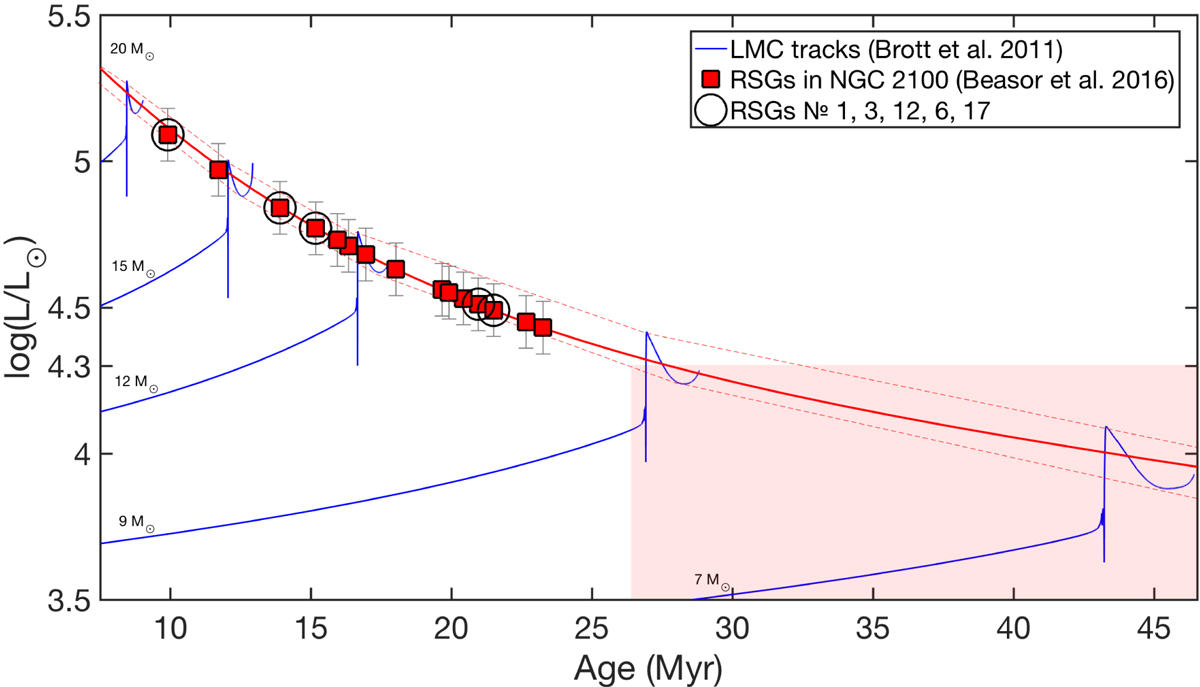
Luminosity–age diagram as in Fig. 7 but using results from Beasor & Davies (2016) for RSGs in the relatively nearby NGC 2100 cluster. The five most distant RSGs from the visual cluster centre are highlighted to investigate potential spatial effects (see text for discussion).
Current usage metrics show cumulative count of Article Views (full-text article views including HTML views, PDF and ePub downloads, according to the available data) and Abstracts Views on Vision4Press platform.
Data correspond to usage on the plateform after 2015. The current usage metrics is available 48-96 hours after online publication and is updated daily on week days.
Initial download of the metrics may take a while.