Fig. 7.
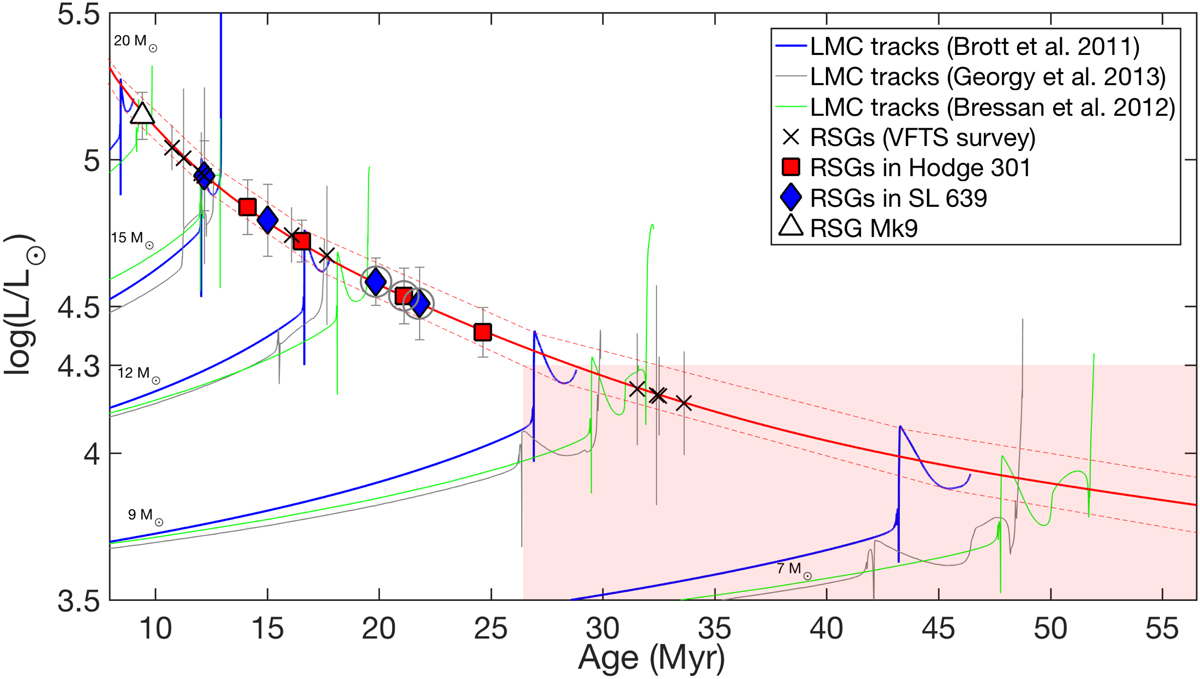
Luminosity–age diagram for our sample of RSGs compared with evolutionary tracks for LMC metallicity from Brott et al. (2011), Georgy et al. (2013), and Bressan et al. (2012). The luminosities that RSGs are expected to occupy during the He-burning phase from the Brott et al. (2011) models are shown by red dashed lines. The red solid line corresponds to a fourth-degree polynomial interpolation of the RSG region: Age = −0.413L4 − 3.868L3 + 128.081L2 − 796.823L + 1534.899 (Myr), where L is in units of log(L/L⊙). This interpolation can be used for ages of 8–55 Myr. The filled red area highlights ages that would be excluded by a luminosity threshold of log(L/L⊙) = 4.3 dex being adopted as a lowest RSG luminosity limit according to Fig. 6. Using our derived stellar luminosities we can place each star in the RSG region to read off an evolutionary age, or age range, as shown. The cluster candidates are denoted by grey circles.
Current usage metrics show cumulative count of Article Views (full-text article views including HTML views, PDF and ePub downloads, according to the available data) and Abstracts Views on Vision4Press platform.
Data correspond to usage on the plateform after 2015. The current usage metrics is available 48-96 hours after online publication and is updated daily on week days.
Initial download of the metrics may take a while.