Fig. 6.
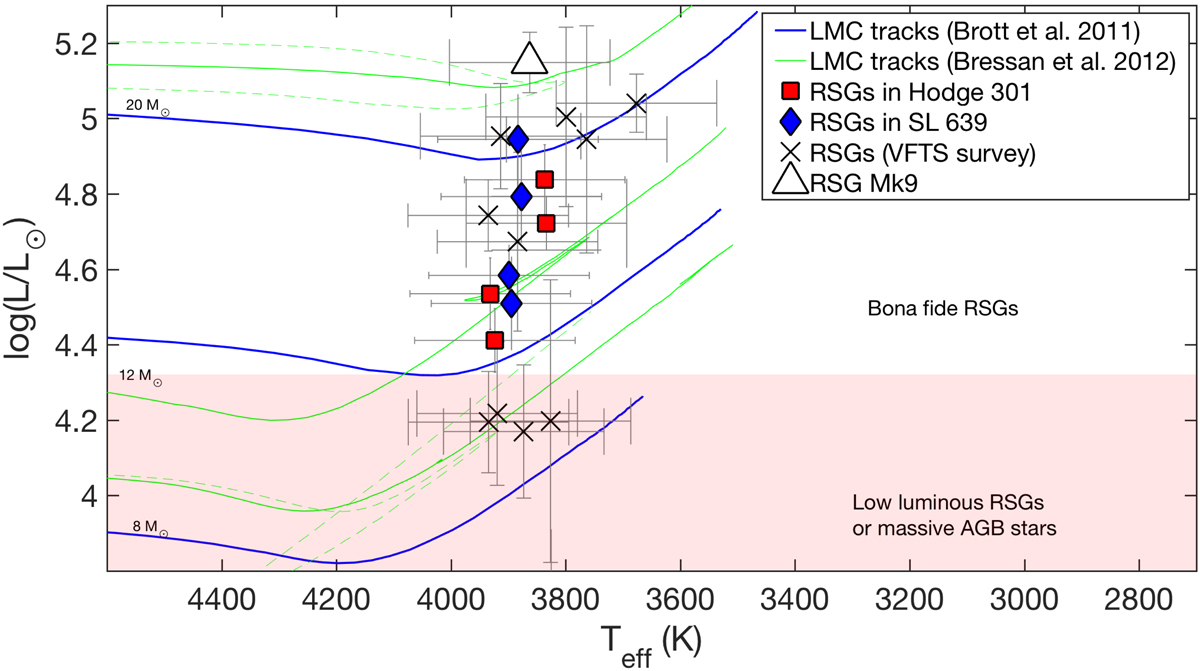
Hertzsprung–Russell diagram for our targets, in which temperatures were estimated using the J − K approach and luminosities estimated from J-band magnitudes. The classifications of the targets based on our analysis are highlighted by the comments and filled region. Blue loops in the PARSEC evolutionary models from Bressan et al. (2012) are indicated by dashed lines (see text for details).
Current usage metrics show cumulative count of Article Views (full-text article views including HTML views, PDF and ePub downloads, according to the available data) and Abstracts Views on Vision4Press platform.
Data correspond to usage on the plateform after 2015. The current usage metrics is available 48-96 hours after online publication and is updated daily on week days.
Initial download of the metrics may take a while.