Free Access
Fig. 3.
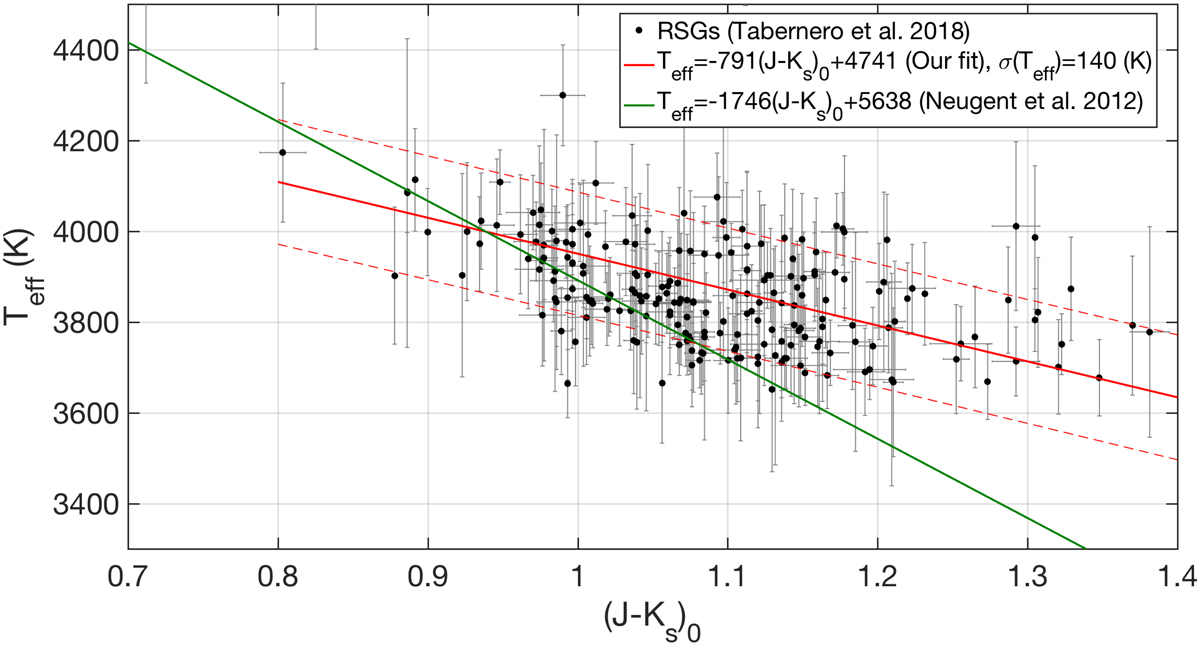
Effective temperature (Teff) vs. (J − Ks)0 colour for the 217 RSGs in the LMC from Tabernero et al. (2018). The red line indicates our linear fit to their data and the green line shows a previous calibration from a sample of yellow SGs and RSGs by Neugent et al. (2012).
Current usage metrics show cumulative count of Article Views (full-text article views including HTML views, PDF and ePub downloads, according to the available data) and Abstracts Views on Vision4Press platform.
Data correspond to usage on the plateform after 2015. The current usage metrics is available 48-96 hours after online publication and is updated daily on week days.
Initial download of the metrics may take a while.