Fig. 7
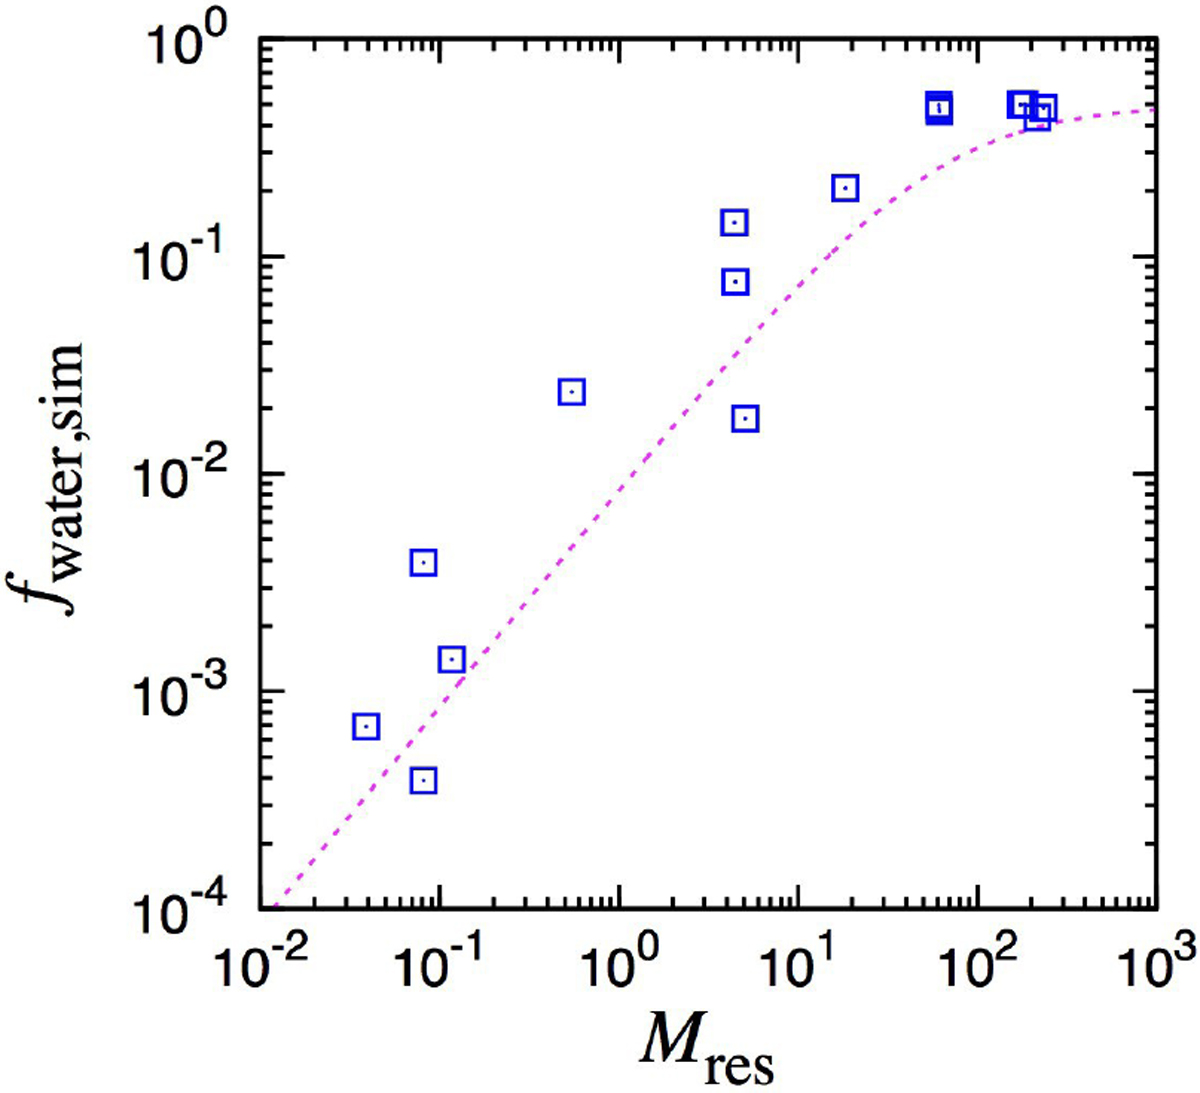
Water fraction fwater,sim and icy dust mass preserved in the outer disk at the snowline passage Mres obtained by our simulations. The blue squares show the simulation results for the Earth analogs with different values of Ṁg,0, Ṁpe, tdiff, and rd,0 (Sect. 2.4). The dotted curve represents the analytical solution given by Eq. (42).
Current usage metrics show cumulative count of Article Views (full-text article views including HTML views, PDF and ePub downloads, according to the available data) and Abstracts Views on Vision4Press platform.
Data correspond to usage on the plateform after 2015. The current usage metrics is available 48-96 hours after online publication and is updated daily on week days.
Initial download of the metrics may take a while.