Free Access
Fig. 8.
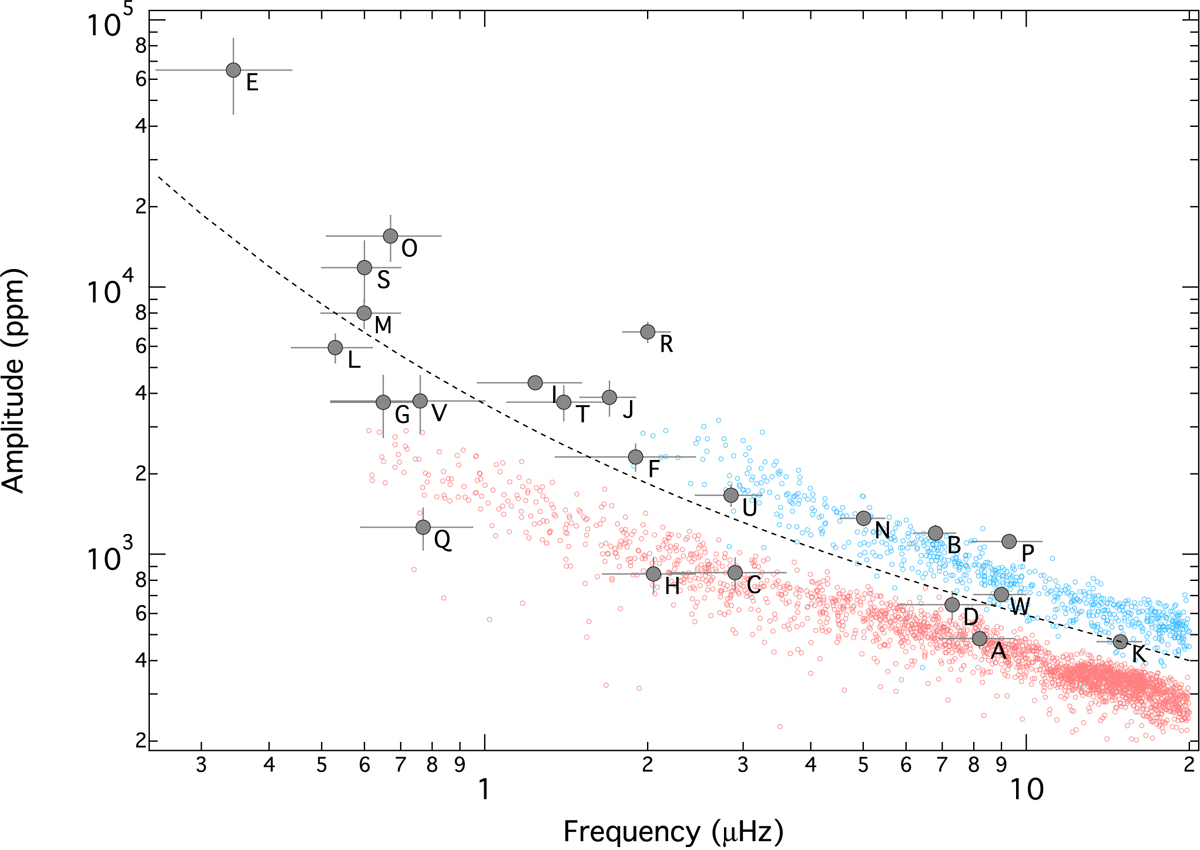
Low- (light-red circles) and high-frequency (light-blue circles) granulation components of a sample of red giant stars observed by Kepler. The dashed line gives a fit to the midpoint of the two components. Overplotted are the stars observed by BRITE-Constellation listed in Table 2.
Current usage metrics show cumulative count of Article Views (full-text article views including HTML views, PDF and ePub downloads, according to the available data) and Abstracts Views on Vision4Press platform.
Data correspond to usage on the plateform after 2015. The current usage metrics is available 48-96 hours after online publication and is updated daily on week days.
Initial download of the metrics may take a while.