Fig. 7.
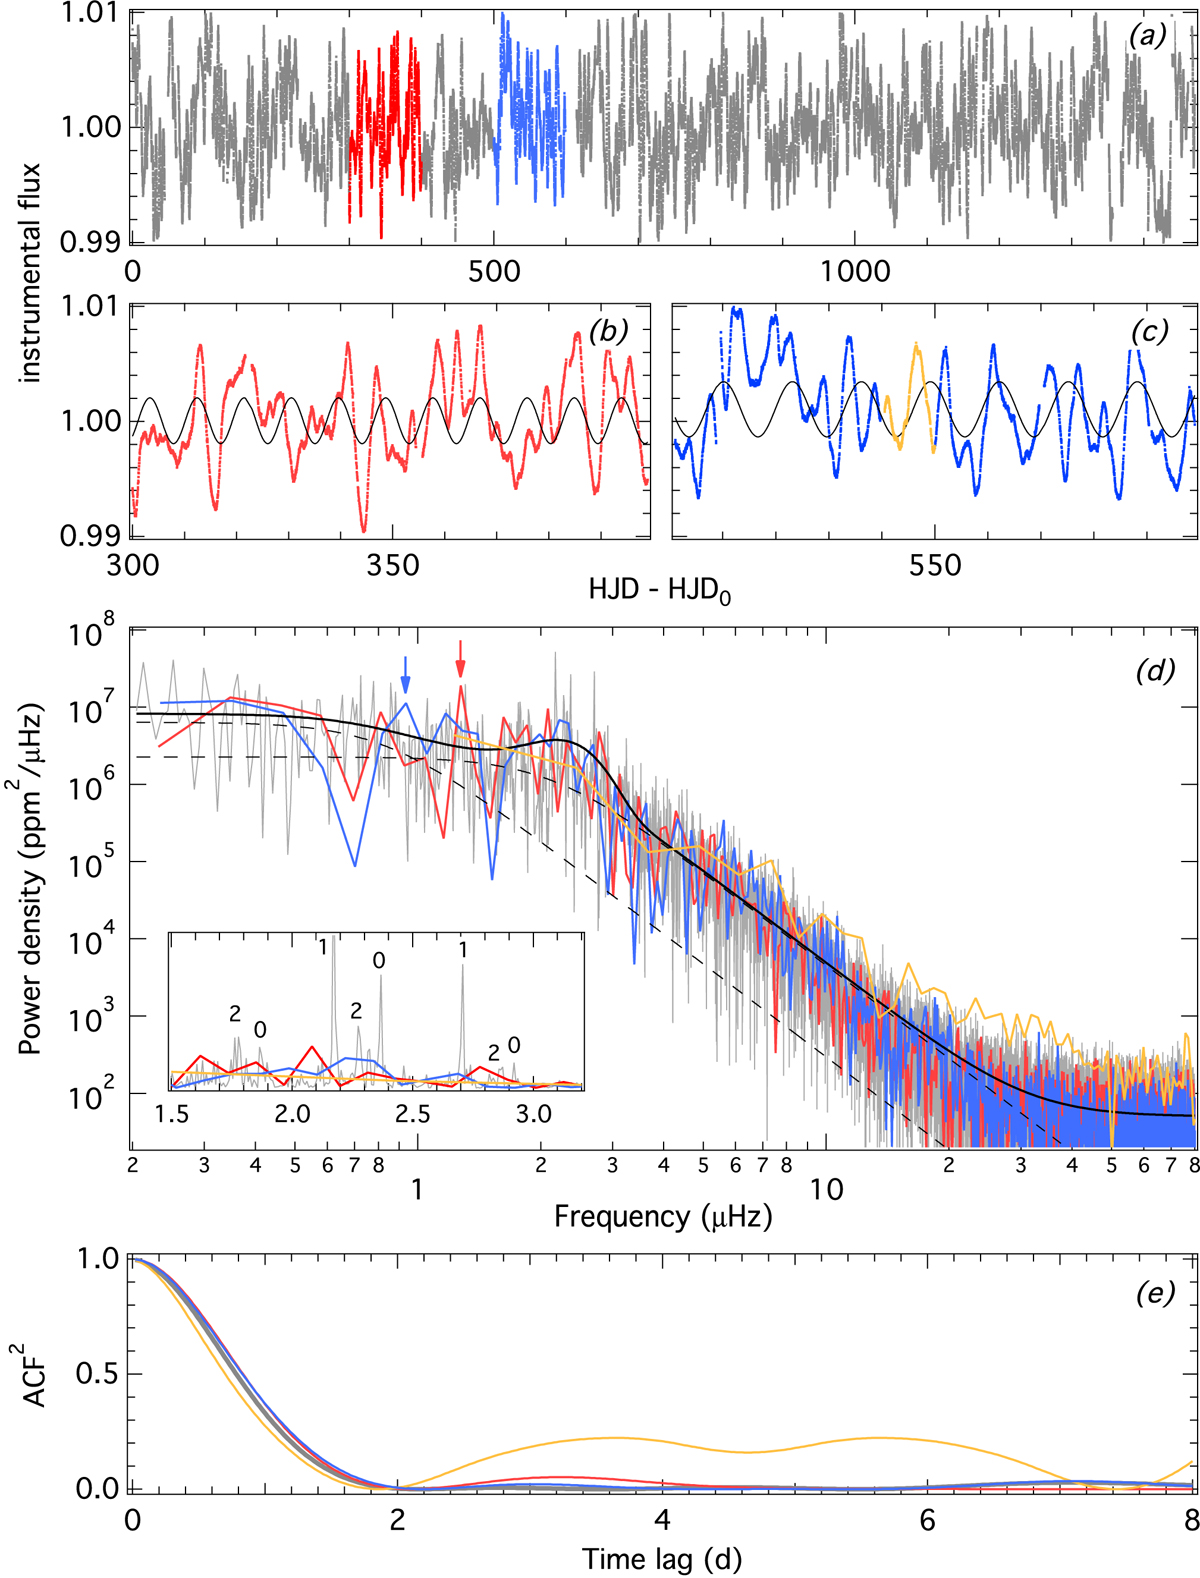
Full 1470-day-long Kepler time series of KIC 1431599 (grey; panel a) and 100- (red and blue) and ten- (orange) day-long subsets (panels b and c). Panel d: corresponding power density spectra along with a global fit (black line) consisting of two granulation components (dashed lines), a Gaussian, and instrumental white noise fitted to the full Kepler time series (Eq. (3)). The largest amplitude peaks in the 100 d PDS are marked with vertical arrows. The corresponding sinusoidal signal is overplotted to the respective time series. The inset shows the frequency range of the oscillation power excess with individual oscillation modes marked by their spherical degree. Panel e: autocorrelation functions of the various time series.
Current usage metrics show cumulative count of Article Views (full-text article views including HTML views, PDF and ePub downloads, according to the available data) and Abstracts Views on Vision4Press platform.
Data correspond to usage on the plateform after 2015. The current usage metrics is available 48-96 hours after online publication and is updated daily on week days.
Initial download of the metrics may take a while.