Fig. 2.
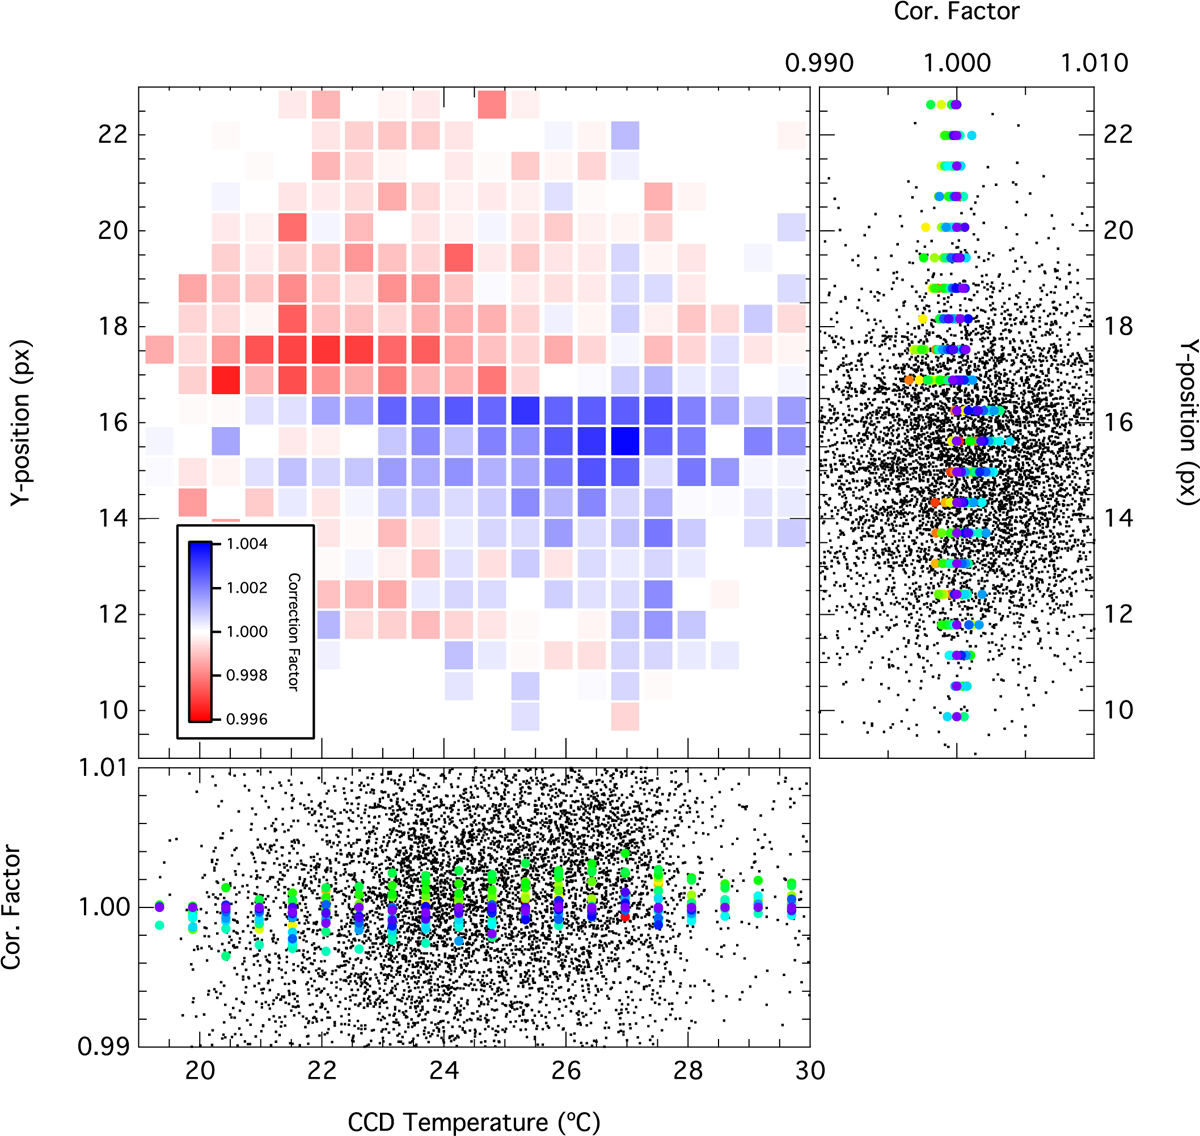
Two-dimensional correction map (CCD-temperature and Y position of the PSF) for the about-30-day-long UBr time series of ε Sco obtained during observing subset 2 with the colour-coded correction factors. Right and bottom panels: correction factor as a function of the Y position of the PSF and CCD temperature, respectively, where the values of the other parameter are colour-coded (with red-green-blue symbols corresponding to low-mean-high values of the other parameter). The black dots are the actual measurements divided by the average value of the time series.
Current usage metrics show cumulative count of Article Views (full-text article views including HTML views, PDF and ePub downloads, according to the available data) and Abstracts Views on Vision4Press platform.
Data correspond to usage on the plateform after 2015. The current usage metrics is available 48-96 hours after online publication and is updated daily on week days.
Initial download of the metrics may take a while.