Fig. 12.
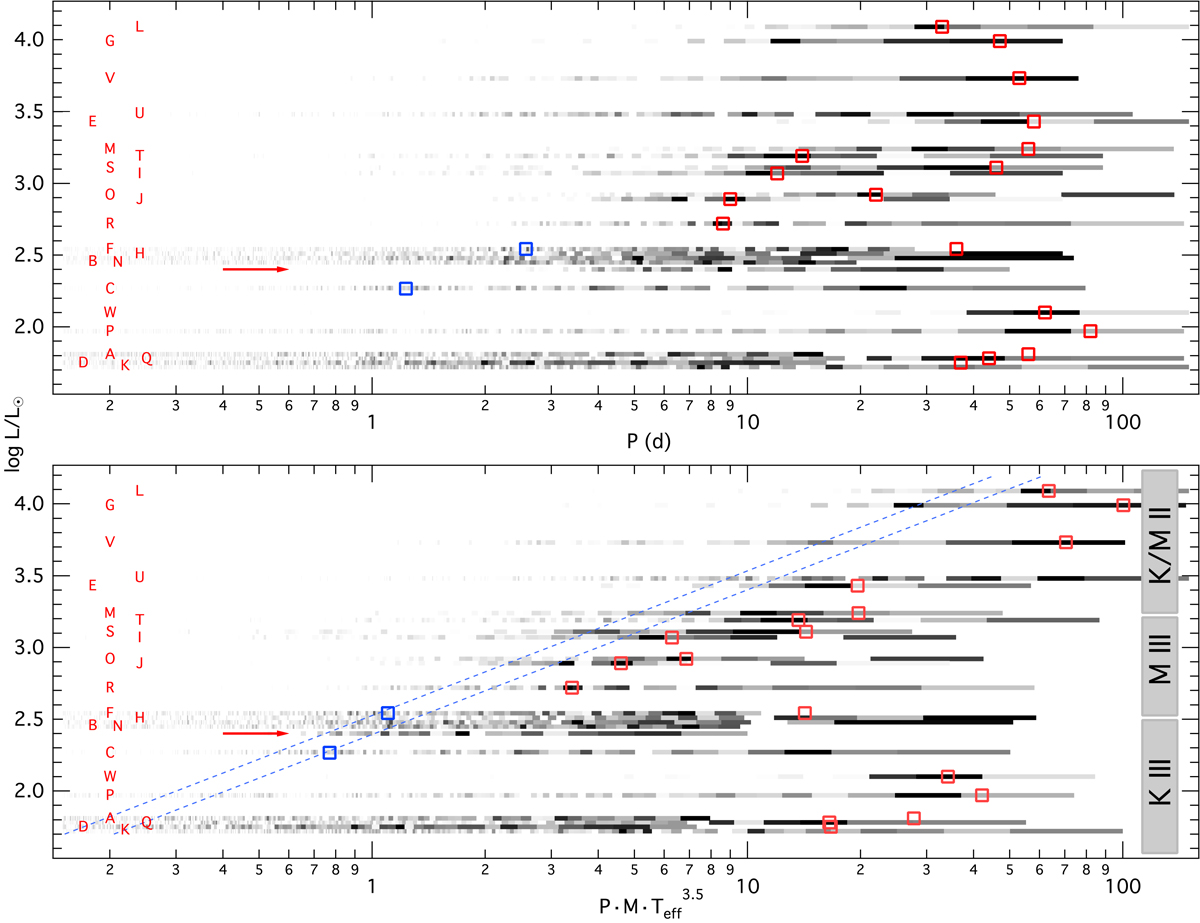
Observed power spectra as a function of period (top) and scaled period (bottom) of our sample stars. The stars are sorted according to their luminosity and displayed as an horizontal band with the level of power indicated by the grey scale. The spectrum of KIC 1431599 (from Fig. 7) is indicated by a red arrow. Open red squares correspond to the dominant periods in the BRITE data and open blue squares indicate our measurements of νmax. The period range in which to expect oscillations is marked with dashed lines. Typical spectral types and luminosity classes are given on the right-hand side.
Current usage metrics show cumulative count of Article Views (full-text article views including HTML views, PDF and ePub downloads, according to the available data) and Abstracts Views on Vision4Press platform.
Data correspond to usage on the plateform after 2015. The current usage metrics is available 48-96 hours after online publication and is updated daily on week days.
Initial download of the metrics may take a while.