Fig. 10.
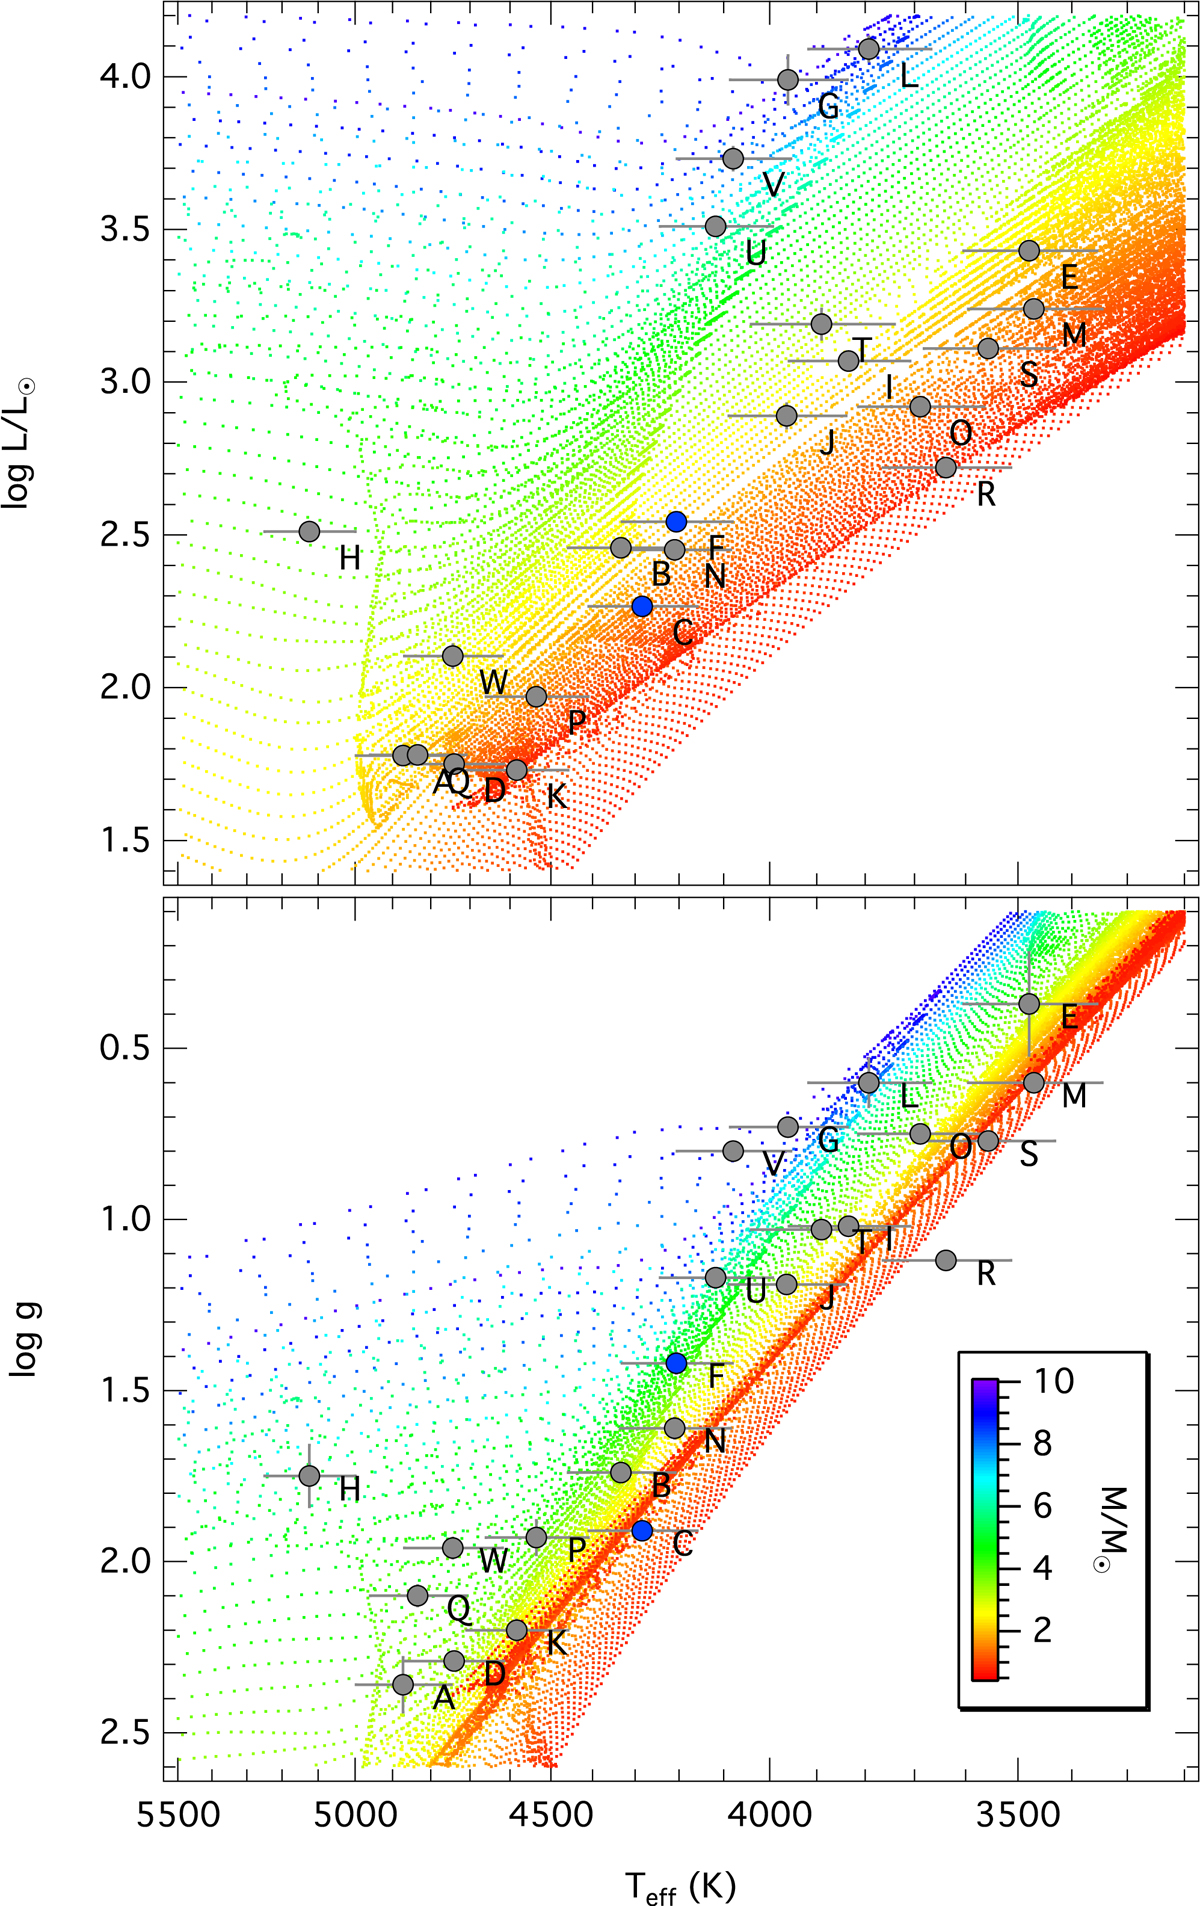
Hertzsprung–Russell (top) and Kiel-diagram (bottom) including the red giants observed by BRITE-Constellation (grey-filled circles). The small dots show MIST stellar evolution models for solar composition with the mass colour coded. Blue-filled circles mark stars for which solar-type oscillations have been found in the BRITE-Constellation data.
Current usage metrics show cumulative count of Article Views (full-text article views including HTML views, PDF and ePub downloads, according to the available data) and Abstracts Views on Vision4Press platform.
Data correspond to usage on the plateform after 2015. The current usage metrics is available 48-96 hours after online publication and is updated daily on week days.
Initial download of the metrics may take a while.