Fig. 12.
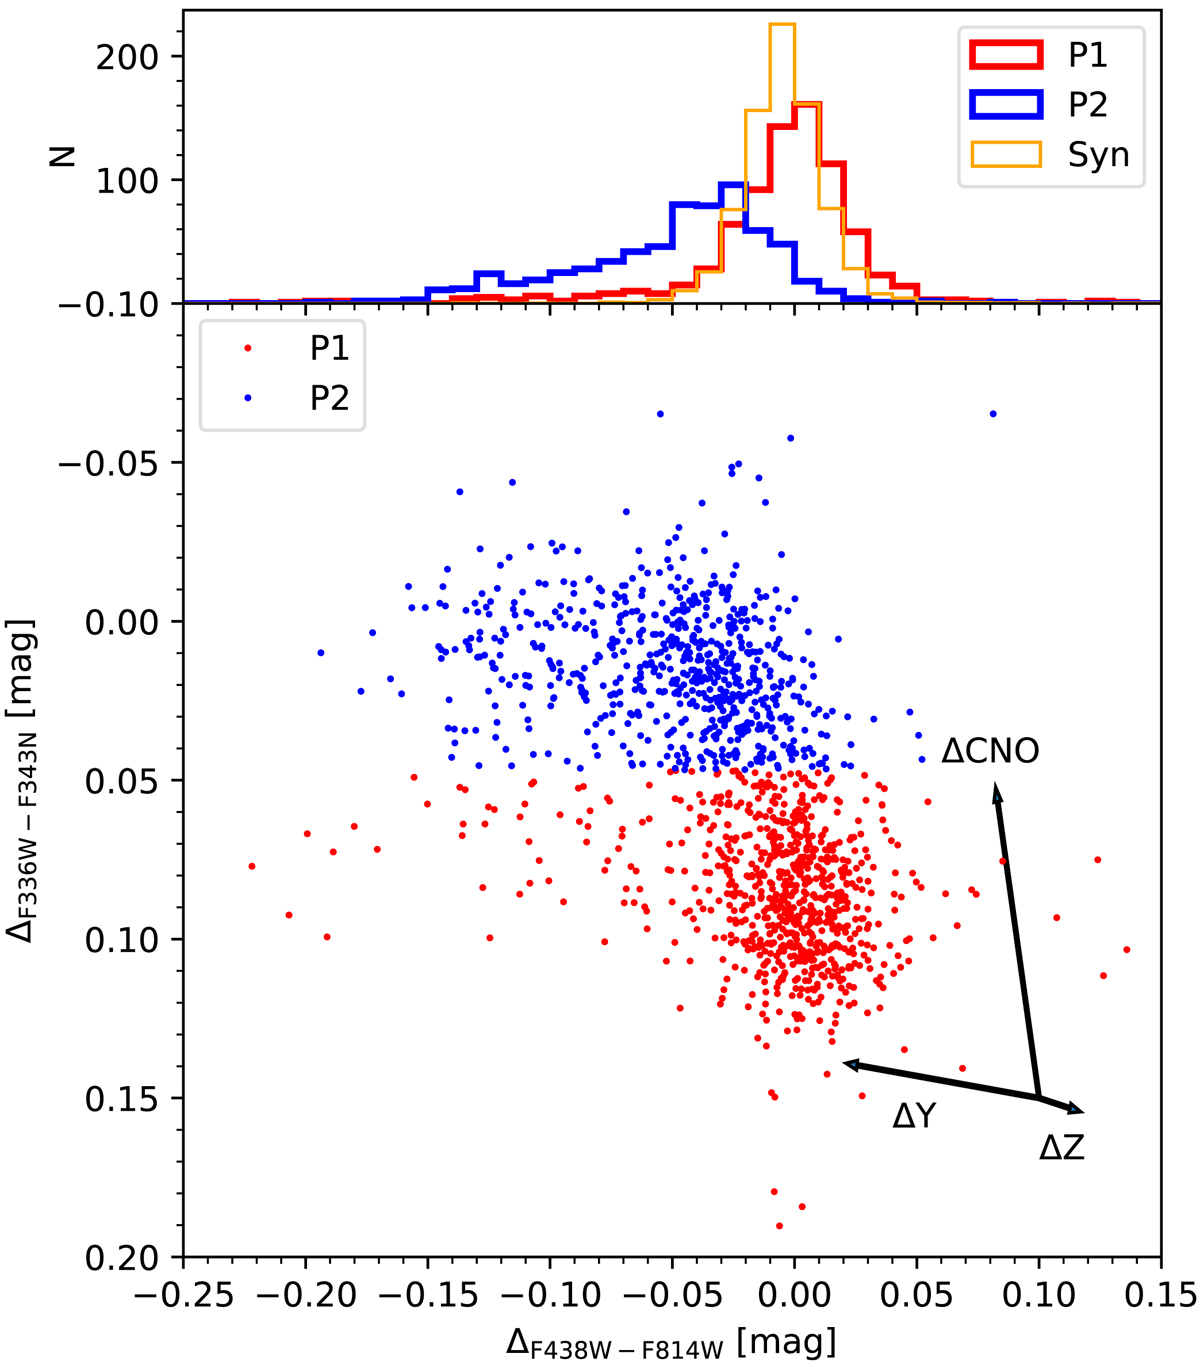
Pseudo-chromosome map and histograms of the ΔF438W−F814W colours for P1 and P2 stars. The thin orange histogram indicates the errors as determined from artificial star tests. The arrows show the effect of changing the He abundance by ΔY = 0.15, the overall metallicity by Δ[Z/H] = +0.1 dex, and the CNONa abundances by Δ([(C, N, O, Na)/Fe]) = −0.6, +1.44, −0.8, +0.8 dex (Sbordone et al. 2011).
Current usage metrics show cumulative count of Article Views (full-text article views including HTML views, PDF and ePub downloads, according to the available data) and Abstracts Views on Vision4Press platform.
Data correspond to usage on the plateform after 2015. The current usage metrics is available 48-96 hours after online publication and is updated daily on week days.
Initial download of the metrics may take a while.