Free Access
Fig. 10.
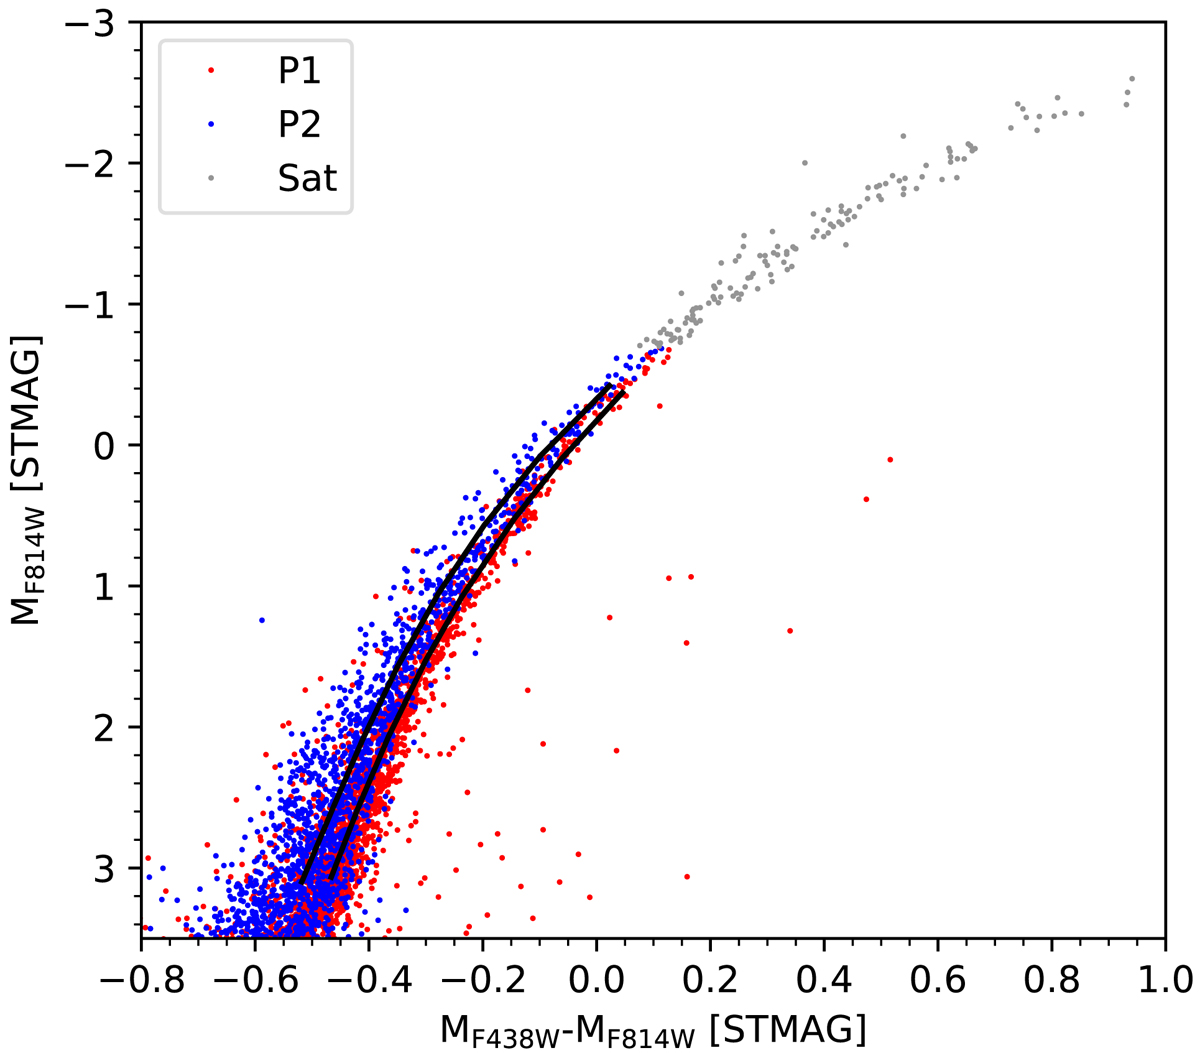
F814W vs. F438W–F814W colour-magnitude diagram, showing the RGB for stars with ΔF336W−F343N > 0.047 (P1) and ΔF336W−F343N ≤ 0.047 (P2). The black curves are polynomial fits to the two sequences. Grey symbols indicate stars which are saturated in F814W.
Current usage metrics show cumulative count of Article Views (full-text article views including HTML views, PDF and ePub downloads, according to the available data) and Abstracts Views on Vision4Press platform.
Data correspond to usage on the plateform after 2015. The current usage metrics is available 48-96 hours after online publication and is updated daily on week days.
Initial download of the metrics may take a while.