Fig. 9
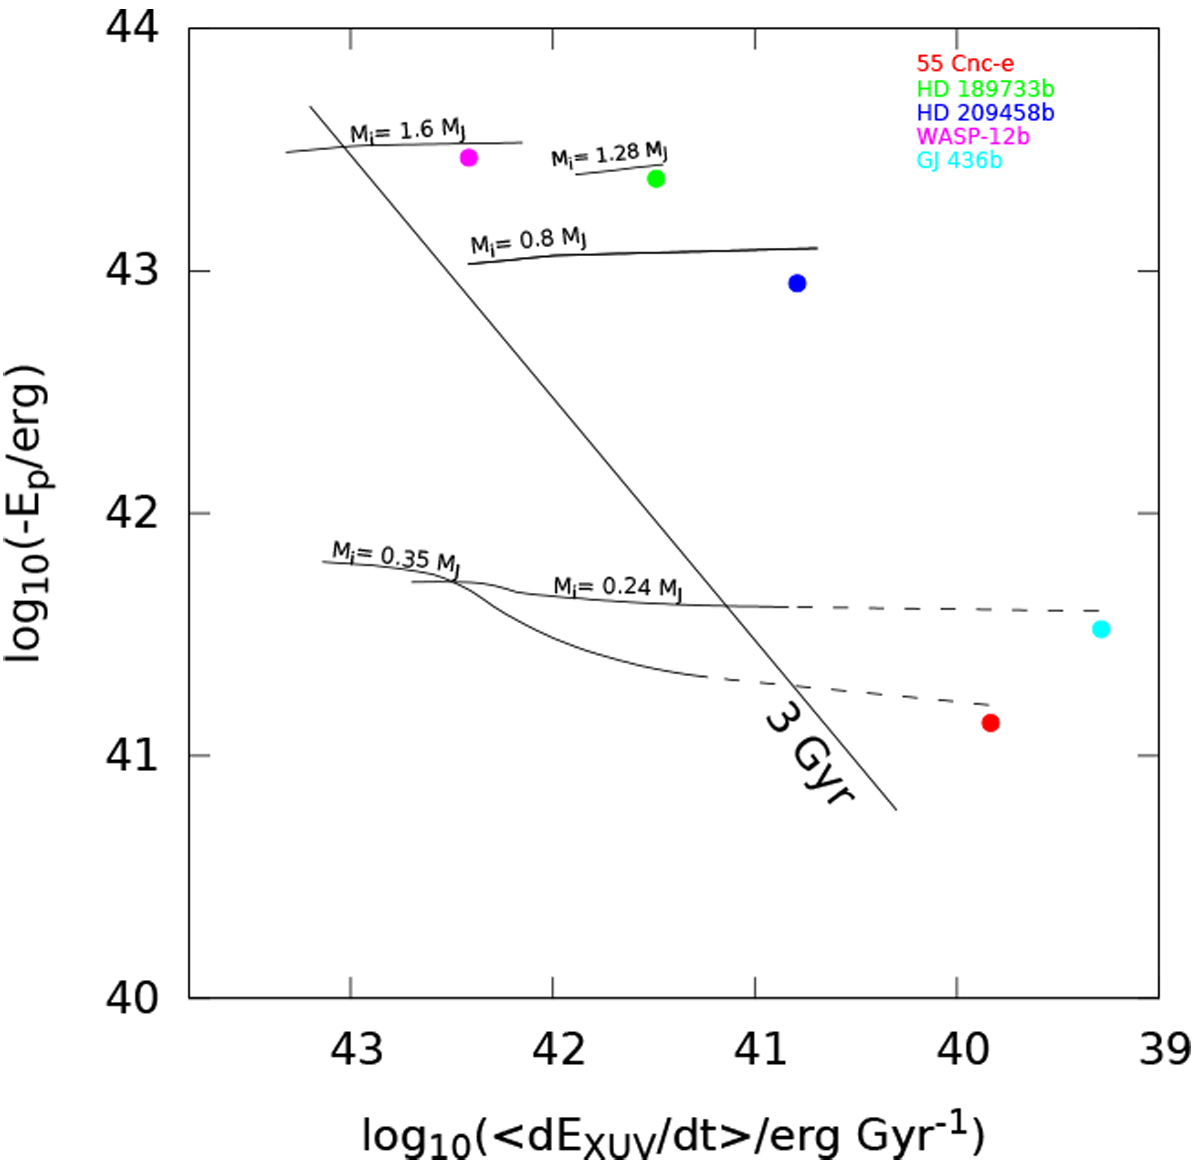
Energy diagrams for five observed exoplanets together with the corresponding evolutionary track. Each simulation is labelled with the initial mass of the planet. The dashed part of the lines indicates the section of the curve that is an extrapolation, as our model is unable to calculate the planetary radius of planets with masses much lower than 0.2 MJ.
Current usage metrics show cumulative count of Article Views (full-text article views including HTML views, PDF and ePub downloads, according to the available data) and Abstracts Views on Vision4Press platform.
Data correspond to usage on the plateform after 2015. The current usage metrics is available 48-96 hours after online publication and is updated daily on week days.
Initial download of the metrics may take a while.