Free Access
Fig. 5
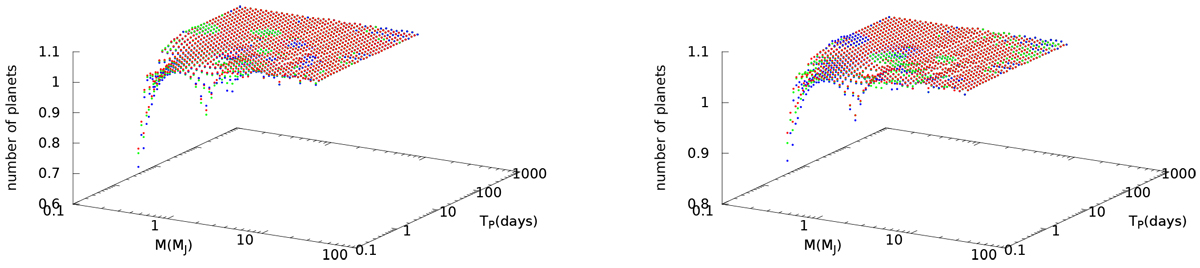
Normalized number of planets as functions of the mass and orbital period; the plot summarizes the data for three different ages: 0.5 (red dots), 1.5 (green dots), and 4.5 (blue dots) Gyr.
Current usage metrics show cumulative count of Article Views (full-text article views including HTML views, PDF and ePub downloads, according to the available data) and Abstracts Views on Vision4Press platform.
Data correspond to usage on the plateform after 2015. The current usage metrics is available 48-96 hours after online publication and is updated daily on week days.
Initial download of the metrics may take a while.