Fig. 4
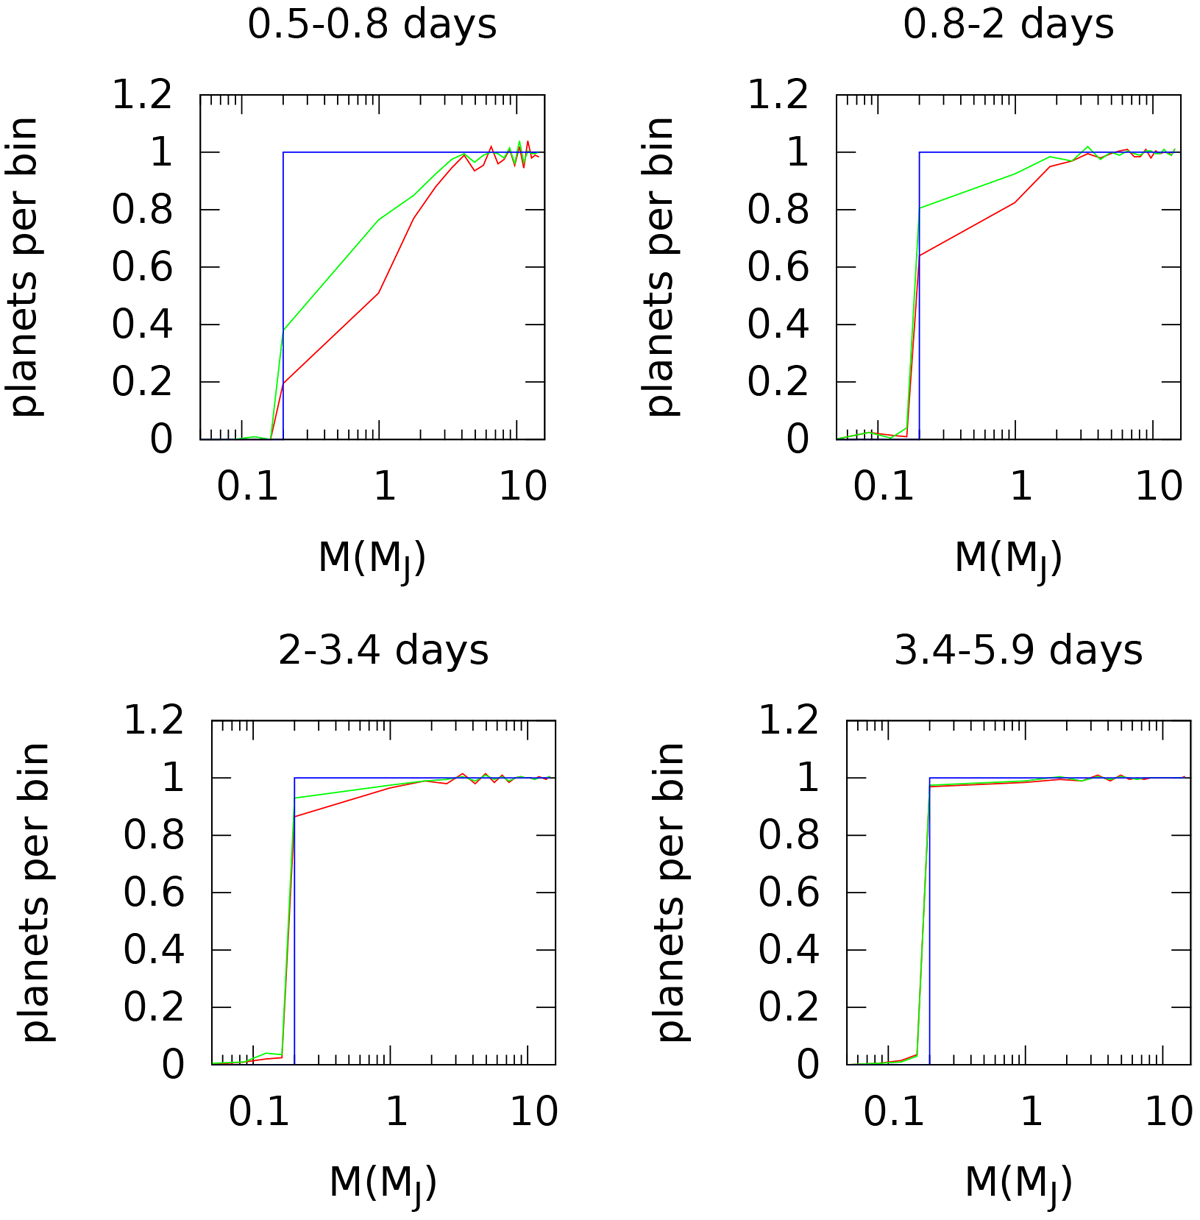
Normalized number of planets per mass bin. Each panel corresponds to an orbital period interval. The initial (flat) mass distribution: blue line; final mass distribution for planets around dG stars: red line; and final mass distribution for planet around dM stars: green line. Since radiative effects are negligible, orbital periods longer than ~ 6 days have not been shown.
Current usage metrics show cumulative count of Article Views (full-text article views including HTML views, PDF and ePub downloads, according to the available data) and Abstracts Views on Vision4Press platform.
Data correspond to usage on the plateform after 2015. The current usage metrics is available 48-96 hours after online publication and is updated daily on week days.
Initial download of the metrics may take a while.