Free Access
Fig. 2
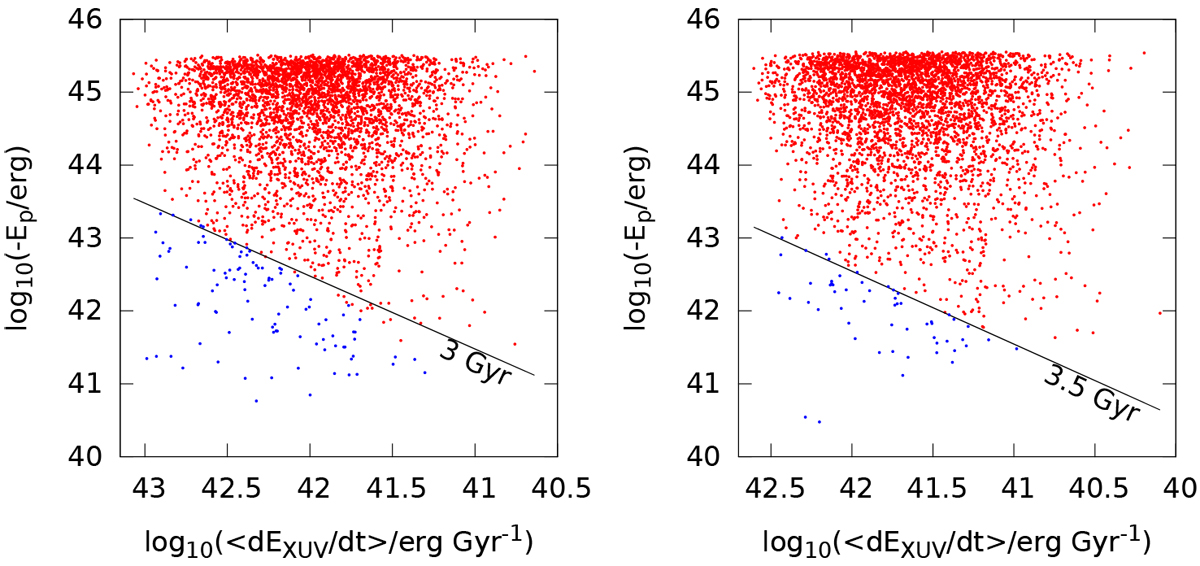
Energy diagram for planets orbiting dG (left panel) and dM (right panel) stars. Red dots represent planets surviving with some fraction of the initial envelope, while blue dots show planets that lost the entire envelope. The solid black line indicates the lifetime line.
Current usage metrics show cumulative count of Article Views (full-text article views including HTML views, PDF and ePub downloads, according to the available data) and Abstracts Views on Vision4Press platform.
Data correspond to usage on the plateform after 2015. The current usage metrics is available 48-96 hours after online publication and is updated daily on week days.
Initial download of the metrics may take a while.