Free Access
Fig. 6
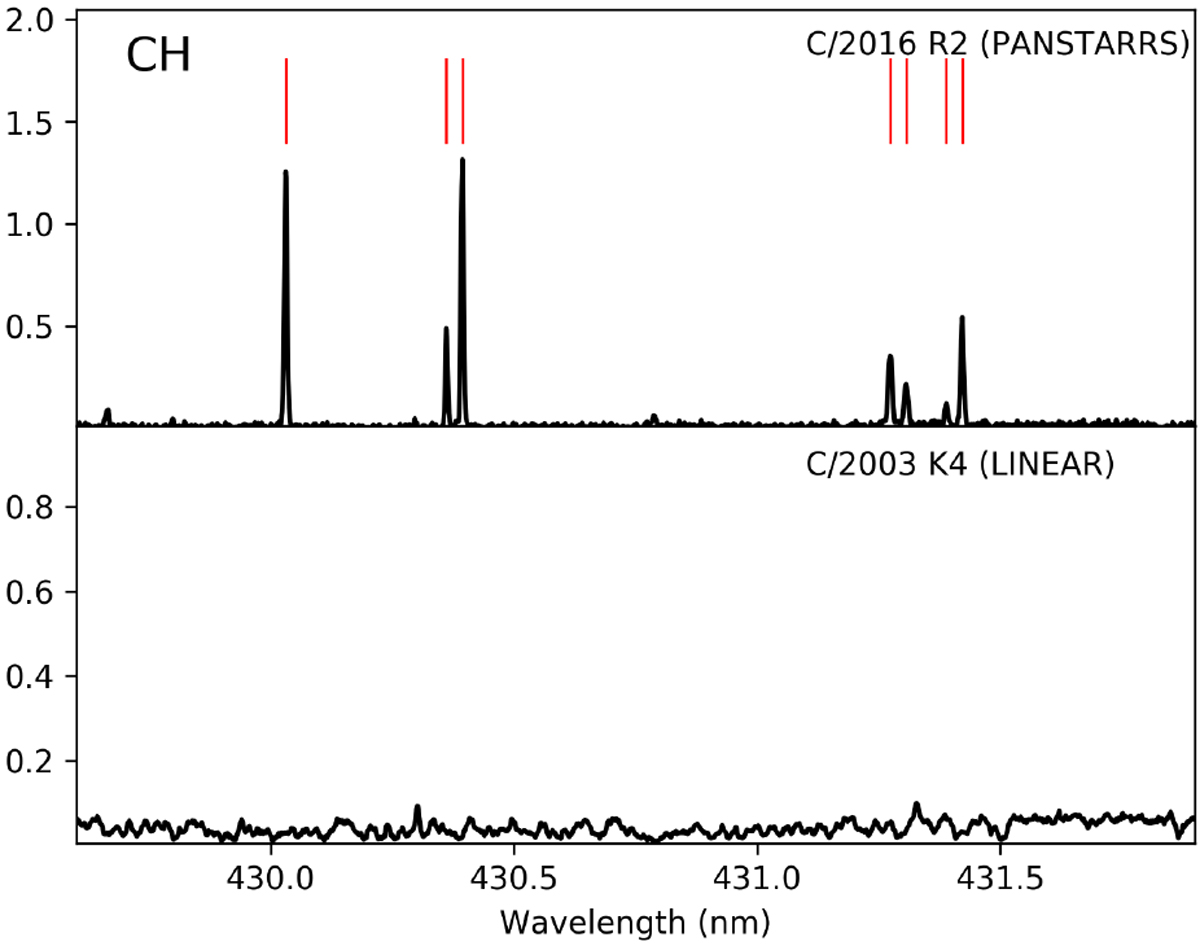
Comparison of the UVES spectra of C/2016 R2 at 2.8 au and C/2003 K4 at 2.6 au over the 429.5 to 432 nm wavelength range, showing the CH lines from the (0,0) band in R2 (indicated by the vertical red lines) and their absence in K4. The y-axis has arbitrary units and has been chosen to display both spectra on a similar scale.
Current usage metrics show cumulative count of Article Views (full-text article views including HTML views, PDF and ePub downloads, according to the available data) and Abstracts Views on Vision4Press platform.
Data correspond to usage on the plateform after 2015. The current usage metrics is available 48-96 hours after online publication and is updated daily on week days.
Initial download of the metrics may take a while.