Free Access
Fig. 14
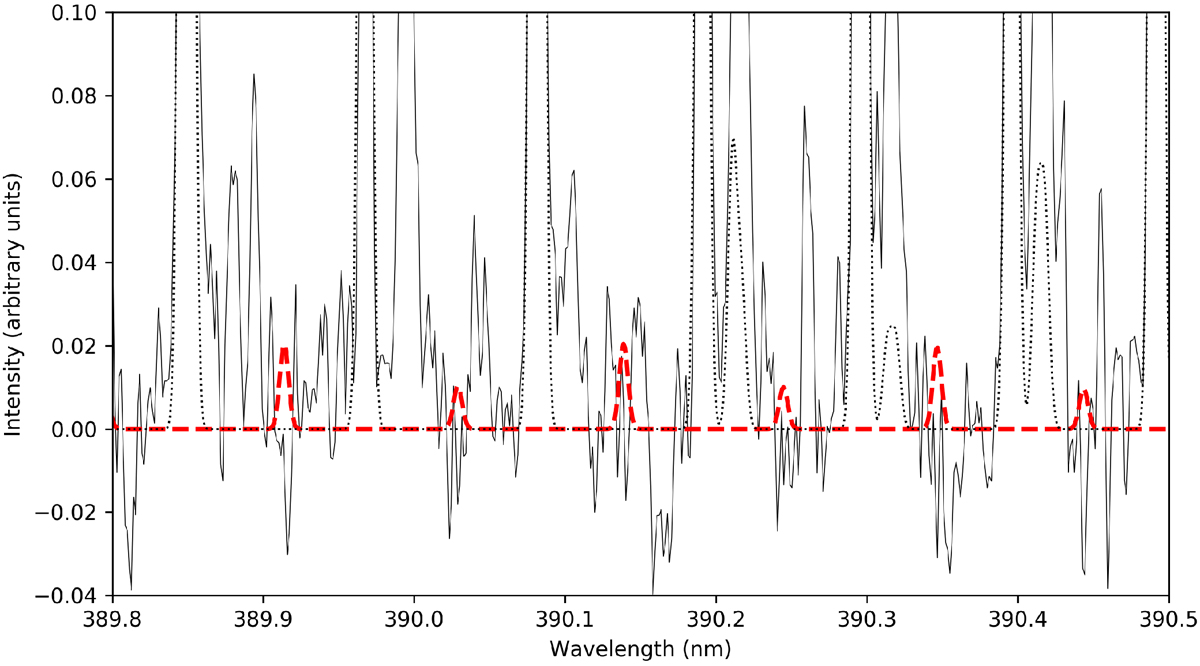
Zoom of the observed spectrum (black) of C/2016 R2 and the 14N15N+ synthetic spectrum computed for 14N/15N = 100 (dashed red curve). The dotted line represents the N![]() synthetic spectrum. In this part of the spectrum only the R lines (the brightest ones) of 14 N15N+ are represented in the synthetic spectrum.
synthetic spectrum. In this part of the spectrum only the R lines (the brightest ones) of 14 N15N+ are represented in the synthetic spectrum.
Current usage metrics show cumulative count of Article Views (full-text article views including HTML views, PDF and ePub downloads, according to the available data) and Abstracts Views on Vision4Press platform.
Data correspond to usage on the plateform after 2015. The current usage metrics is available 48-96 hours after online publication and is updated daily on week days.
Initial download of the metrics may take a while.