Free Access
Fig. 12
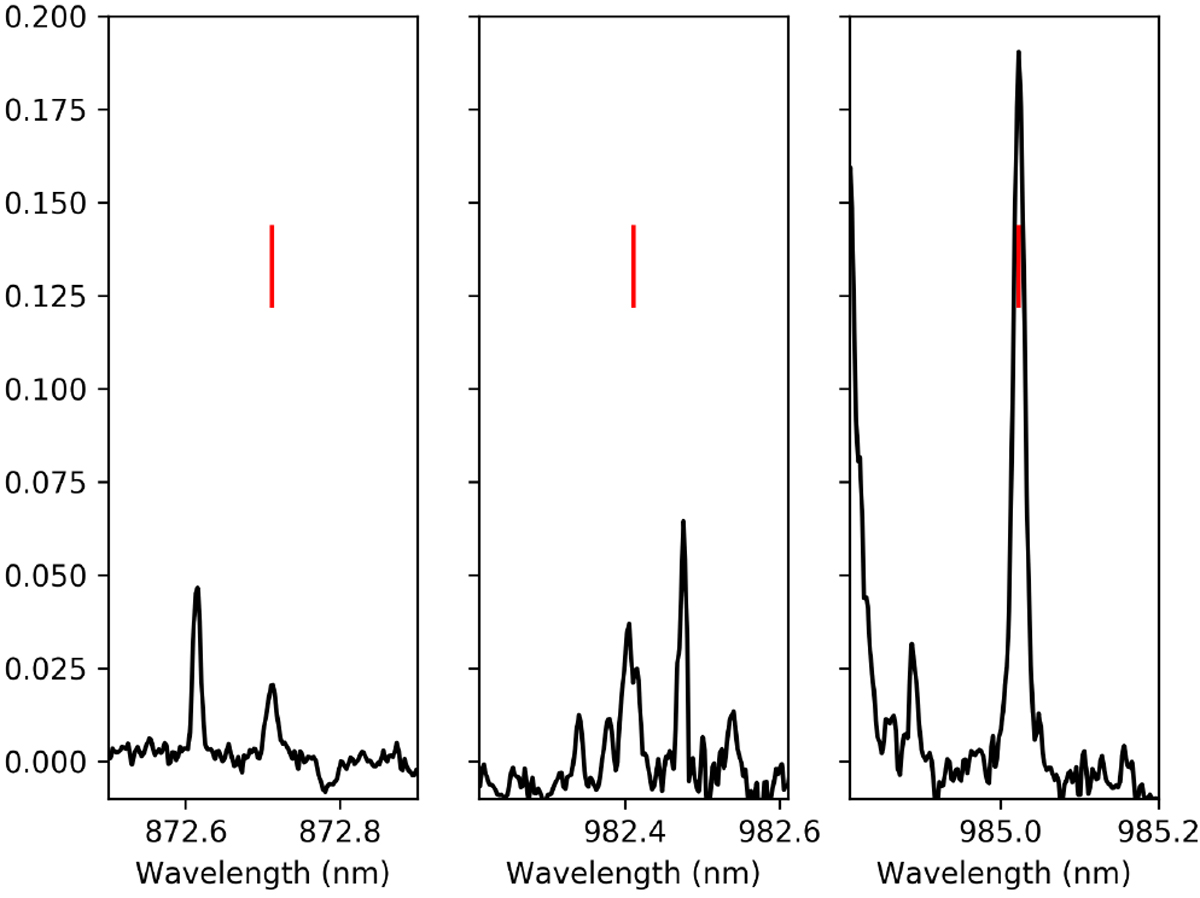
Spectrum of C/2016 R2 corrected from telluric absorption covering the region of the [CI] forbidden lines at 872.7 nm (left panel), 982.4 nm (middle panel), and 985.0 nm (right panel). The red tick marks indicate the position of the carbon forbidden lines. The y-axis is in arbitrary units.
Current usage metrics show cumulative count of Article Views (full-text article views including HTML views, PDF and ePub downloads, according to the available data) and Abstracts Views on Vision4Press platform.
Data correspond to usage on the plateform after 2015. The current usage metrics is available 48-96 hours after online publication and is updated daily on week days.
Initial download of the metrics may take a while.