Fig. 8.
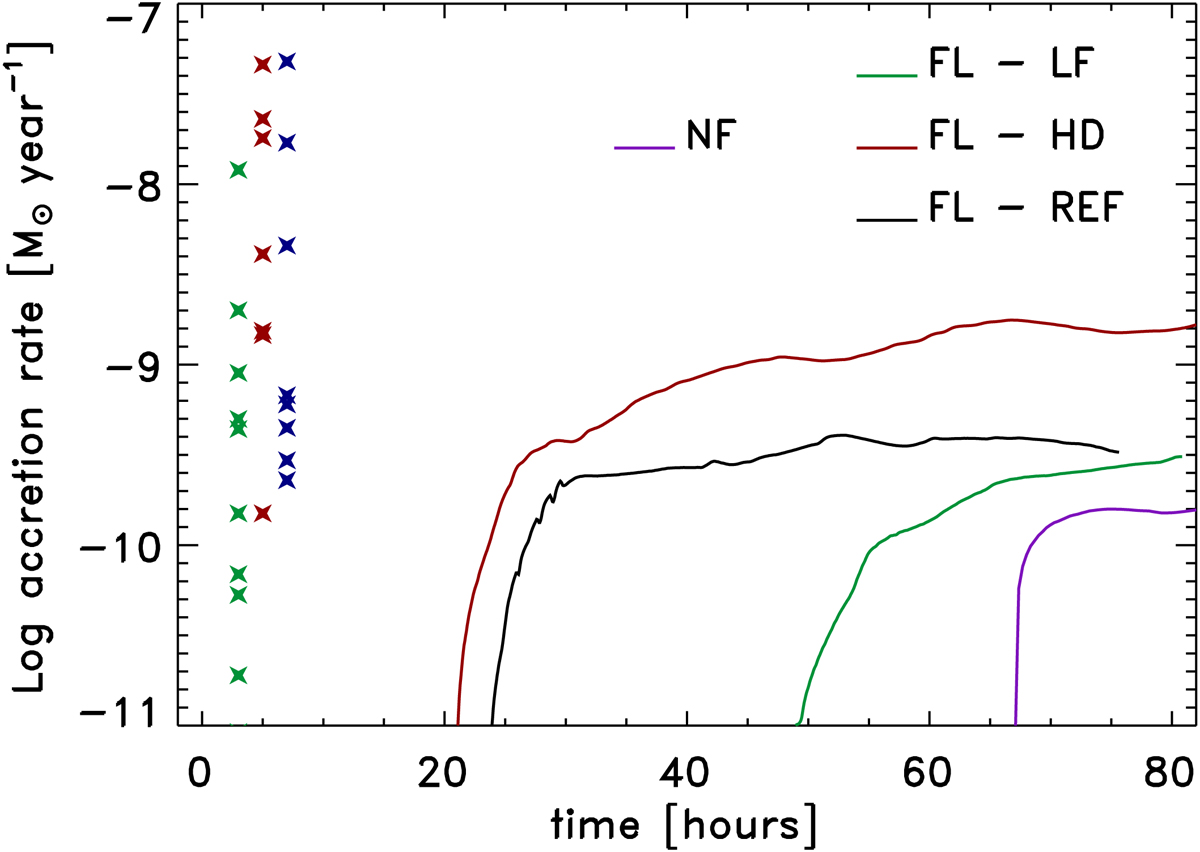
Evolution of accretion rates synthesized from runs FL-RF (black line), FL-HD (red line), FL-LF (green line), and NF (purple line). The crosses represent the values of mass accretion rates inferred from optical-near UV observations for a sample of low-mass stars and brown dwarfs (green, Herczeg & Hillenbrand 2008), for a sample of solar-mass young accretors (red, Herczeg & Hillenbrand 2008), and for an X-ray-selected sample of CTTSs (blue, Curran et al. 2011); their position on the time axis is chosen to facilitate comparison with the model results.
Current usage metrics show cumulative count of Article Views (full-text article views including HTML views, PDF and ePub downloads, according to the available data) and Abstracts Views on Vision4Press platform.
Data correspond to usage on the plateform after 2015. The current usage metrics is available 48-96 hours after online publication and is updated daily on week days.
Initial download of the metrics may take a while.