Fig. 2.
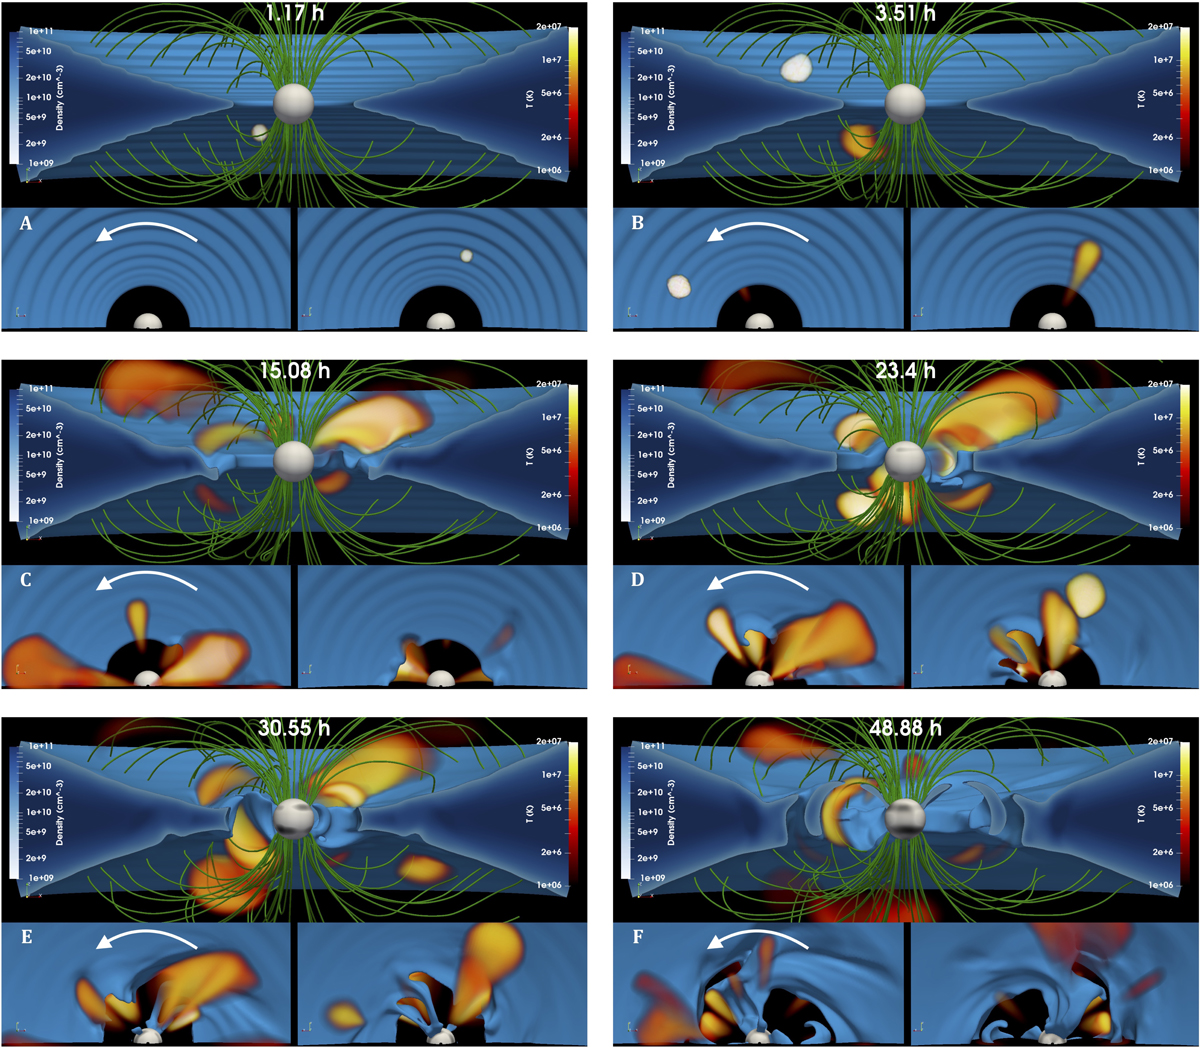
Evolution of the reference case FL-REF. Each of the six panels shows a snapshot at a given time after the initial condition (defined in Sect. 2 in Fig. 1) at 1.17 h (panel A), 3.51 h (panel B), 15.08 h (panel C), 23.4 h (panel D), 30.55 h (panel E), and 48.88 h (panel F). Each panel is composed of three images: at the top, an edge-on view of the 3D system, at bottom left and right, the two pole on views. The cutaway views of the star-disk system show the mass density (blue) and sampled magnetic field lines (green) at different times. A 3D volume rendering of the plasma temperature is overplotted in log scale on each image and shows the flaring loops (red-yellow) that link the inner part of the disk with the central protostar. The color-coded density logarithmic scale is shown on the left of each panel, and the analogously coded temperature scale is on the right. The white arrows indicate the rotational direction of the system. The physical time since the start of the evolution is shown at the top center of each panel.
Current usage metrics show cumulative count of Article Views (full-text article views including HTML views, PDF and ePub downloads, according to the available data) and Abstracts Views on Vision4Press platform.
Data correspond to usage on the plateform after 2015. The current usage metrics is available 48-96 hours after online publication and is updated daily on week days.
Initial download of the metrics may take a while.