Free Access
Fig. 1.
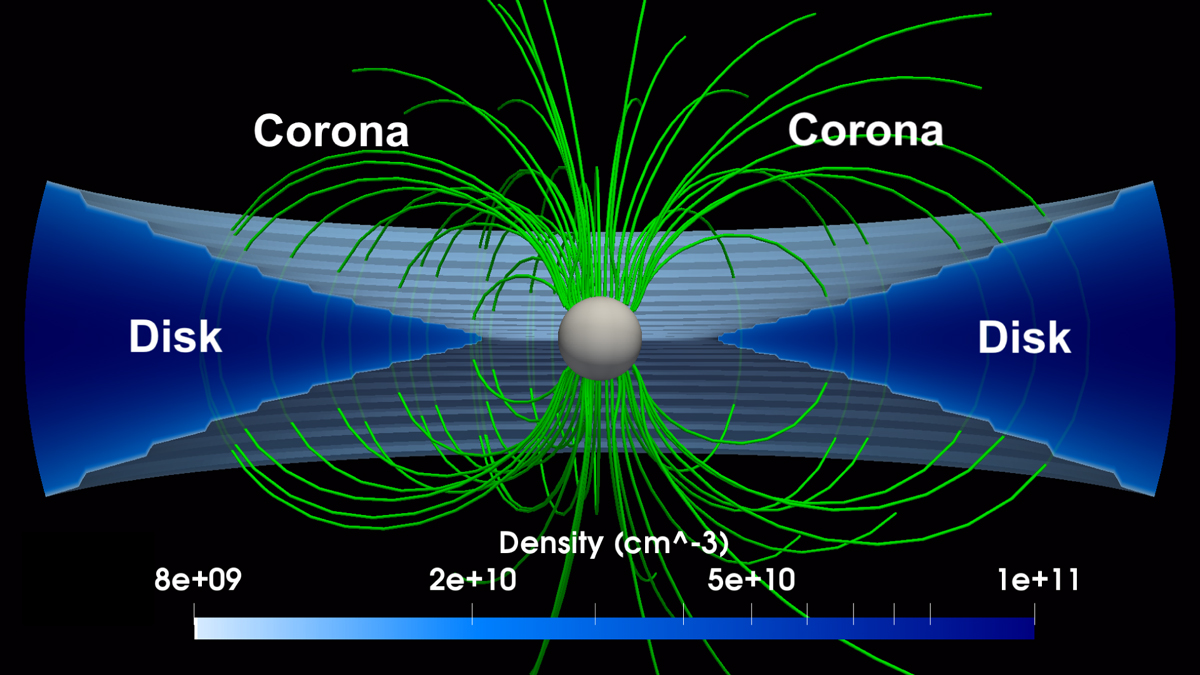
Initial conditions for the reference case. In blue we present in logarithmic scale the density map of the disk, the green lines show the sampled magnetic field lines, and the white sphere represents the stellar surface that marks a boundary.
Current usage metrics show cumulative count of Article Views (full-text article views including HTML views, PDF and ePub downloads, according to the available data) and Abstracts Views on Vision4Press platform.
Data correspond to usage on the plateform after 2015. The current usage metrics is available 48-96 hours after online publication and is updated daily on week days.
Initial download of the metrics may take a while.