Fig. 2.
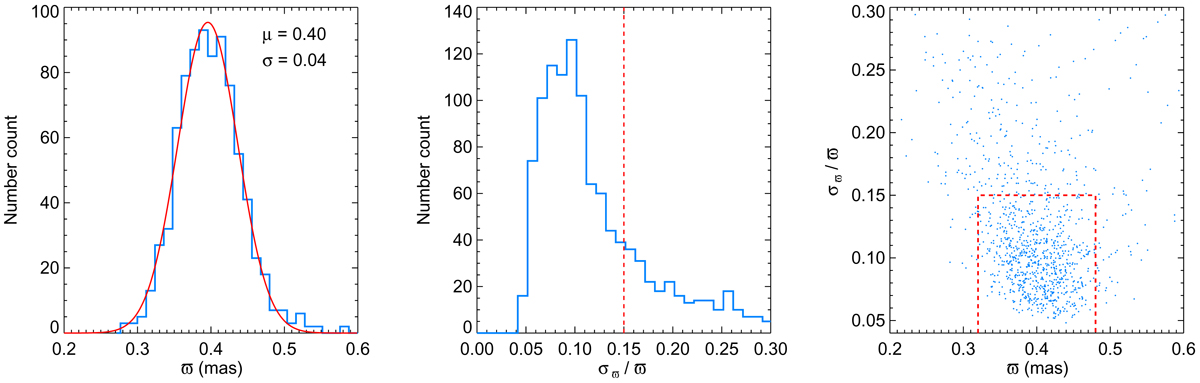
Parallax distribution of core member candidates selected by the proper motion criteria. Left panel: histogram of parallax ϖ that can be fitted by a single Gaussian profile. The distribution of relative deviation of ϖ is shown in the central panel; the red dashed curve represents the acceptable maximum σϖ/ϖ boundary, which includes 68% of the candidates in the histogram. Right panel: the parallax criteria is indicated with the red dashed curve.
Current usage metrics show cumulative count of Article Views (full-text article views including HTML views, PDF and ePub downloads, according to the available data) and Abstracts Views on Vision4Press platform.
Data correspond to usage on the plateform after 2015. The current usage metrics is available 48-96 hours after online publication and is updated daily on week days.
Initial download of the metrics may take a while.