| Issue |
A&A
Volume 624, April 2019
|
|
|---|---|---|
| Article Number | A144 | |
| Number of page(s) | 9 | |
| Section | Astrophysical processes | |
| DOI | https://doi.org/10.1051/0004-6361/201834320 | |
| Published online | 26 April 2019 | |
High energy spatially radiative properties of Vela X pulsar wind nebula
1
Department of Physics, Yuxi Normal University, Yuxi 653100, PR China
2
Department of Astronomy, Key Laboratory of Astroparticle Physics of Yunnan Province, Yunnan University, Kunming 650091, PR China
e-mail: This email address is being protected from spambots. You need JavaScript enabled to view it.
Received:
26
September
2018
Accepted:
13
March
2019
Abstract
Context. Vela X is a middle-aged pulsar wind nebula (PWN) that has been detected in radio, X-ray, and γ-ray bands. The observations indicate that that photon index and flux density of the inner regions of the nebula have obvious changes as the radial distance increases in the X-ray band, and the surface brightness has been discovered to decrease with the increase of radial distance in γ-ray band.
Aims. The multi-band photon emission and high energy spatially radiative properties of Vela X are investigated in the framework of a spatially dependent particle transport model.
Methods. Electron distribution inside the PWN was described by a spatially dependent particle transport equation and the evolution of the non-thermal photon was described as a photon conservation equation under the assumption of a spherically symmetric system with dynamical evolution. In this model, the dynamical and particle evolution equations were simultaneously solved, and the γ-ray attenuation by the supernova remnant (SNR) photon fields in the PWN were taken into account.
Results. The observed spectral energy distributions of Vela X, including X-ray spectra of the inner regions and γ-ray spectra observed at GeV and TeV bands, are well reproduced. The radial variations of the photon index in X-ray band and the surface brightness in the TeV energy range as well as the γ-ray spectra of the inner region and ring extension can also be well reproduced in the framework of our model. The spatial variations of photon indices at GeV and TeV bands are predicted and show that the photon index in GeV band increases with the increase of radial distance while there is only a slight change in the TeV band. Moreover, the modelling results reveal that the γ-ray attenuation by the SNR photon fields is important for modifying very high energy γ-ray spectrum of Vela X.
Key words: pulsars: general / ISM: individual objects: Vela X / radiation mechanisms: non-thermal
© ESO 2019
1. Introduction
Vela X is a middle-aged pulsar wind nebula (PWN) that is powered by the Vela pulsar (PSR B0833-45; Weiler & Panagia 1980), and located in the centre of the Vela supernova remnant (SNR). As one of the closest pulsars to the Earth, the Vela pulsar has a period of P = 89.3 ms (Large et al. 1968) and a period derivative of Ṗ = 1.25 × 10⁻¹³ s s−1 (Lyne et al. 1996), which implies that the current spin-down luminosity of this pulsar has a value of L0 = 6.9 × 1036 erg s−1 and a characteristic age of τc = 11.3 kyr (Taylor et al. 1993; Lyne et al. 1996). The value of distance to the Vela SNR is estimated to be 290 pc according to the radio and optical parallax measurements (Caraveo et al. 2001; Dodson et al. 2003), and the age is usually considered to be the characteristic age of the Vela pulsar (Reichley et al. 1970; Manzali et al. 2007). Lyne et al. (1996) estimated that the braking index for the Vela pulsar has a value of n = 1.4. However, based on the new long-term braking index measurements, Espinoza et al. (2017) suggested that the value of the braking index of the Vela pulsar is n = 1.7, which is adopted in this paper.
The photon emission from Vela X has been detected at radio, X-ray, and γ-ray bands, and showed that the nebula is a morphologically complex source. At radio and GeV energy ranges, Vela X shows a filamentary structure usually referred to as the halo (e.g. Abdo et al. 2010; Hinton et al. 2011; Grondin et al. 2013). In the radio band, Alvarez et al. (2001) revealed that the PWN has a power-law spectral index of 0.39 ± 0.03 in the 30 − 8400 MHz energy range. In the GeV γ-rays, according to the Fermi Large Area Telescope (LAT) observations, Abdo et al. (2010) revealed that the non-thermal spectrum of Vela X can be well fitted by a power law with a photon index of 2.41 ± 0.09 ± 0.15 in the 0.2 − 20 GeV energy range, and Grondin et al. (2013) pointed out that the photon spectrum above 0.2 GeV can be well described by a smoothly broken power law with spectral indices of Γ1 = 1.83 ± 0.07 ± 0.27, Γ2 = 2.88 ± 0.21 ± 0.06 and a break energy of Eb = 2.1 ± 0.5 ± 0.5 GeV. In the X-ray band, the ROAST observations revealed a much smaller emission region usually called the cocoon. (Markwardt & Ögelman 1995), and the Chandra X-ray images showed a double torus and jet-like structure at the centre of the PWN (Helfand et al. 2001). The ROAST and ASCA data found that the power-law photon index in the X-ray band has a value of 2.1 (Markwardt & Ögelman 1995, 1997), and the XMM-Newton data showed that the photon index is 2.3 (LaMassa et al. 2008). In the inner regions of the nebula, based on the XMM-Newton/MOS and BeppoSAX/MECS data, Mangano et al. (2005) pointed out that the power-law photon index and flux density in the 3 − 10 keV energy range have obvious changes as the radial distance increases. In the TeV γ-rays, the photon emission region, which has been detected by High Energy Stereoscopic System (H.E.S.S.), is coincident with the radio halo and X-ray cocoon. (Aharonian et al. 2006; Abramowski et al. 2012). Aharonian et al. (2006) have shown that the energy spectrum of Vela X in the 0.55 − 65 TeV energy range can be well fitted by an exponentially cut-off power-law function, with a photon index of 1.45 ± 0.09stat ± 0.2sys and an exponential cut-off at an energy of 13.8 ± 2.3stat ± 4.1sys TeV. While according to the deeper observation of the entire Vela X nebula region with H.E.S.S., Abramowski et al. (2012) revealed that the total differential energy spectrum in the energy of 0.75 − 70 TeV can be well described with a hard photon index of 1.32 ± 0.06stat ± 0.12sys and a cut-off energy of 14.0 ± 1.6stat ± 2.6sys TeV. Moreover, the H.E.S.S. Collaboration reported that the energy averaged surface brightness of Vela X decreases with the increase of radial distance in the TeV γ-ray band (Abramowski et al. 2012).
To interpret the non-thermal radiative properties of Vela X, various models have been proposed (e.g. Horns et al. 2006; de Jager et al. 2008; Zhang & Yang 2009; Abdo et al. 2010; Hinton et al. 2011; Mattana et al. 2011). Under the assumption that the particles in the nebula are composed of electrons and hadrons, Horns et al. (2006) proposed a leptonic-hadronic model, in which the X-ray emission is produced by the synchrotron radiation of relativistic electrons and the TeV photons are mainly from the decay of neutral pions produced in proton-proton collisions inside the nebula. In parallel, de Jager et al. (2008) suggested that there are two distinct electron populations existing in Vela X, one is responsible for the observed spectrum in radio and GeV γ-ray bands, and the other for the X-ray and TeV γ-ray emission. Both the leptonic-hadronic and leptonic models can well reproduce the non-thermal photon spectrum of Vela X. However, these two models cannot explain the spatial variations of the energy spectrum of the PWN observed at X-ray and TeV γ-ray bands, because the distribution of particles in the nebula is assumed to be uniform. In recent years, a spatially dependent particle transport model was proposed to explain the spatial variation properties of PWNe (e.g. Vorster & Moraal 2013; Porth et al. 2016; Lu et al. 2017a; Ishizaki et al. 2017; van Rensburg et al. 2018), in which the particle number density is spatially dependent and the processes of convection and diffusion are taken into account. Assuming that the PWN is a spherical symmetric system, Porth et al. (2016) studied the radial variations of the photon index and flux density of Vela X in the X-ray band with a steady-state particle transport model, and found that the spatial variations of photon index and flux density of the inner regions of the nebula can be well reproduced in the framework of their model. However, Porth et al. (2016) did not investigate the multi-band photon emission and spatially radiative properties of γ-rays of the PWN, because their main aims are to investigate the particle transport and the influence of the diffusion effect on the particle spectrum.
In this paper, we study the multi-band photon emission and high energy spatially radiative properties of Vela X in the framework of a spatially dependent particle transport model proposed by Lu et al. (2017a). In the model, the object is assumed to be a spherical symmetric system. The X-ray and very high energy (VHE) γ-ray observations have shown that the Vela X nebula is a highly asymmetric PWN (Markwardt & Ögelman 1995; Aharonian et al. 2006; Abdo et al. 2010). However, the X-ray observations of the inner region of Vela X show a bright X-ray nebula that is approximately spherically symmetric (Mangano et al. 2005; Mattana et al. 2011). Besides, the multi-wavelength maps of the analysis region of Vela X are usually treated as a circular region (e.g. Aharonian et al. 2006; Abdo et al. 2010; Abramowski et al. 2012; Tibaldo et al. 2018). Thus, as a first-order approximation, the spatially dependent and spherical symmetric model can help us to study the spatial variations of azimuthally integrated spectra in the Vela PWN. The organization of the paper is as follows. In Sect. 2, the spatially dependent particle transport model is simply described and the modelling results are presented. The main conclusions and discussions are given in Sect. 3.
2. Model and results
In this section, the spatially dependent particle transport model of Lu et al. (2017a) will be briefly reviewed, and the modelling results of Vela X, including the spectral energy distributions (SEDs), radial variations of photon index, and flux density of the X-ray emission in the inner regions of the nebula, as well as the spatial variations of photon indices and surface brightness in the GeV and TeV bands, will be presented.
2.1. Model description
In a spherically symmetric system, the evolution of electron distribution ne = ne(r, γ, t) inside the PWN can be described with the particle transport equation
![Mathematical equation: $$ \begin{aligned} \frac{\partial {n_{\rm e}}}{\partial {t}} =&\kappa \frac{\partial ^2n_{\rm e}}{\partial {r}^2}+ \left[\frac{1}{r^2}\frac{\partial }{\partial {r}}(r^2\kappa )-V\right]\frac{\partial {n_{\rm e}}}{\partial {r}}-\frac{1}{r^2}\frac{\partial }{\partial {r}}\left[r^2V\right]n_{\rm e}\nonumber \\&+\frac{\partial }{\partial {\gamma }}\left[\dot{\gamma }n_{\rm e}\right]+Q_{\rm inj}, \end{aligned} $$](/articles/aa/full_html/2019/04/aa34320-18/aa34320-18-eq1.gif) (1)
(1)
where the processes of convection, diffusion, adiabatic loss, and radiative losses are taken into account. In the above equation, r represent the radial position, γ is the Lorentz factor of electrons, κ = κ(r, γ, t) is the particle diffusion coefficient, V = V(r) is the convection velocity,  is the total energy loss rate of electrons, and Qinj is the electrons injected at the termination shock. The number of particles per energy interval that flow through the termination shock should be equal to the number of particles injected from the central pulsar, which implies the inner boundary condition can be expressed as (e.g. Ng & Gleeson 1975; Vorster & Moraal 2013)
 (2)
(2)
where r0(t) is the radius of the termination shock at time t and V0 represents the particle convection velocity at the shock.
According to de Jager et al. (2008), the particles in Vela X are assumed to be composed of two distinct electron populations, one at low energies responsible for the radio and GeV γ-ray emission and the second higher energy population for the X-ray and TeV emission. Thus, the distribution of injected electrons at the termination shock is given by
 (3)
(3)
where Q0, i(t) is the normalization constant and can be calculated by
 (4)
(4)
Here, ηi (i = R, X) is the fraction of spin-down luminosity L(t) of a pulsar converted to relativistic particle energy in each respective component. Assuming that the pulsar is a pure dipole radiator with a braking index of n, the time evolution of the spin-down luminosity of a pulsar can be given by
 (5)
(5)
where L0 is the initial luminosity and τ0 = 2τc/(n − 1)−Tage is the initial spin-down timescale, and Tage is the age of the pulsar. In Eq. (3), γmax, i is the respective maximum energy of the two distinct electron populations, γmin, i is the minimum energy of electrons, which is assumed to be 1.0 in this paper according to de Jager et al. (2008), and α1 and α2 = 2.0 are the corresponding spectral indices.
Following Kennel & Coroniti (1984a,b), the magnetic field in the PWN is assumed to be toroidal, and then the time and spatial evolutions of magnetic field in the nebula can be described as
![Mathematical equation: $$ \begin{aligned} B(r,t)=B_0(t)\left[\frac{r_0(t)}{r\upsilon (r)}\right], \end{aligned} $$](/articles/aa/full_html/2019/04/aa34320-18/aa34320-18-eq7.gif) (6)
(6)
where υ(r) is the radial profiles of the convection velocity, and B0(t) is the magnetic field at the termination shock that is obtained by  , where Rpwn(t) is the radius of the PWN. The function WB(t) is calculated with dWB(t)/dt = ηBL(t)−[WB(t)/Rpwn(t)][dRpwn(t)/dt] and ηB is the fraction of pulsar spin-down luminosity converted to magnetic field energy (e.g. Pacini & Salvati 1973). According to Lerche & Schlickeiser (1981), the evolution of the diffusion coefficient is given by
![Mathematical equation: $$ \begin{aligned} \kappa (r,\gamma , t)=\kappa _0(t)\left(\frac{\gamma m_{\rm e}c^2}{1\,\mathrm{TeV}}\right)\left[\frac{r_0(t)}{r\upsilon (r)}\right]^{-1}, \end{aligned} $$](/articles/aa/full_html/2019/04/aa34320-18/aa34320-18-eq9.gif) (7)
(7)
and κ0(t)∝1/B(t) is the diffusion at the termination shock.
In the model, the evolution of non-thermal photons arising from the radiation processes of relativistic electrons of the PWN is described as a photon conservation equation
 (8)
(8)
In the above equation, nγ = nγ(r, x, t) is the number density of photons with the dimensionless photon energy x = E/mec2, tesc represents the photon escape timescale,  and
and  are the emissivity of synchrotron radiation and inverse Compton process, respectively,
  is the loss rate for photons caused by the process of synchrotron self-absorption, and
  is the lose rate of photon–photon pair production inside the PWN. A more detailed description and numerical calculation of the spatially dependent model are shown in Lu et al. (2017a); Lu et al. (2017b), and the radial variations of surface brightness and photon index at different bands are calculated according to Holler et al. (2012).
The dynamical evolution of the PWN is simulated according to the model presented by Bucciantini et al. (2011). In their model, the object is assumed to be a spherically symmetric system and the proper motion of the pulsar as well as the radiation losses of particles are negligible, and then the dynamical evolution of a PWN is divided into three phases: free-expansion, reverberation, and Sedov–Taylor phases. In the initial free-expansion phase, the radius of the PWN is given by
 (9)
(9)
where Esn is the energy of the supernova explosion, Mej is the mass of the supernova ejecta, s = (t/τ0)/(1 + t/τ0), and the coefficients ci are given in Bucciantini et al. (2004). In the reverberation phase, the dynamical evolution radius is calculated with
![Mathematical equation: $$ \begin{aligned} M_{\rm sw}\ddot{R}_{\rm pwn}(t)=4\pi R^2_{\rm pwn}(t)[P_{\rm in}(t)-P_{\rm out}(t)]. \end{aligned} $$](/articles/aa/full_html/2019/04/aa34320-18/aa34320-18-eq16.gif) (10)
(10)
Here, Msw is the mass of material swept up by the PWN when it expands inside the SNR, Pin is the pressure of the PWN shell, and Pout is the pressure of the SNR ejecta at the position of the PWN shell. In the Sedov–Taylor phase, the radius is determined by
 (11)
(11)
where tSedov is the time at which the Sedov–Taylor phase begins,  is the pressure in the SNR forward shock, where vfs is the speed of the forward shock, and ρism is the number density of the interstellar medium (ISM). Finally, the dynamical evolution radius of the termination shock is estimated by
  , where Pts(t) is the pressure of the gas at the shock (Bucciantini et al. 2004), and the evolution of SNR are calculated with the semi-analytic model provided by Truelove & McKee (1999).
It should be noted that the SNR photon fields may prevent high energy γ-rays from leaving the PWN via γ + γ → e+ + e− (e.g. Murase et al. 2015). In this paper, the γ-ray attenuation must also be taken into account and the photon fields of SNR are assumed to be a thermal spectrum for simplicity. According to Murase et al. (2015), the optical depth to pair production is approximated as
 (12)
(12)
where Rej(t) is the radius of the SNR ejecta, and  is the photon density of SNR with a temperature of Tsn. Here kB is the Boltzmann constant and σT represents the Thomson cross section. The function 𝒢(y) = ℱ(y)/ζ(3) with y = mec2/xkBTsn, in which ℱ(y) is given by Dermer et al. (2012) and ζ(3) = 1.202 is the Riemann’s zeta function. In order to consider the γ-ray attenuation by SNR photon fields, the photon spectrum is modified by multiplying by a factor of e−τγγ−sn.
2.2. Results
Vela X is a dynamical system that shows a complex morphology at different observation bands (e.g. Aschenbach et al. 1995; Helfand et al. 2001; Aharonian et al. 2006; Grondin et al. 2013). It is generally believed that the PWN flow has been crushed by the SNR reverse shock, which leads to Vela PWN having a very complex observation morphology (e.g. Abdo et al. 2010; Hinton et al. 2011). With the parameters listed in Table 1, we calculated the dynamical radii of the Vela SNR system, including the radius of the SNR (RSNR), reverse shock (Rrs), PWN (Rpwn), and termination shock (Rts) in the framework of our model. The results are shown in Fig. 1, where the stars represent the current radius and termination shock radius of Vela PWN and imply that the nebula is in the phase of reverberation. From the dynamical modelling results, we obtain that the radius of Vela X has a value of Rpwn(Tage)=1.25° and the termination shock radius is Rts(Tage)=37″ at the age of Tage = 11.3 kyr, which is consistent with the values Rpwn(Tage)=1.2° shown in Abramowski et al. (2012) and Rts(Tage)=25″ derived by Ng & Romani (2004).
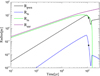 |
Fig. 1. Dynamical evolution radius of SNR (Rsnr, purple line), reverse shock (Rrs, green line), PWN (Rpwn, black line) and the termination shock (Rts, blue line). The stars represent the current radius and terminate shock radius of Vela PWN at Tage = 11.3 kyr. |
Since the photon SEDs of Vela X at different energy bands of different emission regions and the radial variations of photon index in the X-ray band as well as the surface brightness in the TeV γ-rays have been observed, all of the observations should be reproduced by our model to obtain the best-fit parameters. In the calculation, we first reproduced the photon SEDs of different emission regions roughly, and then adjusted the parameters of the initial diffusion coefficient and magnetic fraction ηB to reproduce the radial variations of the photon index and flux in the X-ray band as well as surface brightness in the TeV γ-rays, which due to the radial profiles are mainly determined by the competition of synchrotron radiation loss and particle diffusion (e.g. Vorster & Moraal 2013), and then adjusted the fitted parameters again to reproduce the photon SEDs. We repeated the above steps and we obtained the parameters of Vela X, which are listed in Table 1.
The photon SEDs of Vela X calculated with our model are shown in Fig. 2, where the left panel is the comparison of our model results of the PWN with the observed data from the radio to γ-ray bands, and the right panel is the comparison of model results with the data observed in the γ-ray band. The soft photon fields, which include three components in the calculation, are as follows: the cosmic microwave background (CMB, temperature 2.73 K, photon density 0.26 eV cm−3), the galactic far-infrared background (FIR, temperature 25 K, photon density 12.0 eV cm−3), and the near-infrared and optical photon field (NIR) due to the stars (temperature 6500 K, photon density 0.4 eV cm−3). The χ2 value of the model results with the observed data in the GeV band is 2.2 and in the TeV for the inner emission region of r = 48 arcmin we obtain 2.5. The luminosity of Vela X at different bands of the different emission regions respectively derived from the model and the observations are shown in Table 2, revealing that the luminosities at different bands obtained by our model are consistent with the results of observations with the exception of the TeV γ-ray luminosity. The TeV γ-ray luminosity obtained by our model is less than the result estimated by Aharonian et al. (2006), but the integral flux above 1 TeV derived from our model of 1.9 × 10⁻¹¹ cm−2 s−1 is consistent with the value 2.1 × 10⁻¹¹ cm−2 s−1 obtained by Abramowski et al. (2012) according to the deeper observation of H.E.S.S.
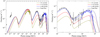 |
Fig. 2. Comparison of modelling results of Vela X with the observed data at different emission regions of r = 6 arcmin (dark-yellow line), r = 15 arcmin (red line), and r = 48 arcmin (blue line), as well as the total flux (black line). Left panel: modelling SEDs from radio to γ-ray bands. Right panel: modelling SEDs in the γ-ray band. The dash-dotted lines are the unabsorbed spectra, and the solid lines consider γ-ray attenuation by the SNR photon fields. The observed data are taken from Abdo et al. (2010) for radio band (black, full circles), Mattana et al. (2011) and Mangano et al. (2005) for X-rays of the inner regions of r = 6 arcmin (dark-yellow, solid thick line) and r = 15 arcmin (red, solid thick line), Grondin et al. (2013), Ajello et al. (2017), and Tibaldo et al. (2018) for GeV γ-rays (black, open circles), and Abramowski et al. (2012) for TeV γ-rays emission within r = 48 arcmin (blue, full circles), respectively. |
As seen in Fig. 2, the observed SEDs of Vela X, including X-ray photon spectra of the inner emission regions and γ-ray spectra in the GeV and TeV bands, can be well reproduced in the framework of our model with the parameters shown in Table 1, while the radio photon spectrum cannot. It should be pointed out that we did not find any set of appropriate parameters to reproduce the SED of Vela X in the radio band based on the spherically symmetric spatially dependent model. From the modelling results, we can also see that the process of γ-ray attenuation by the SNR photon field is important for modifying the VHE γ-ray spectrm of Vela X (see the right panel of Fig. 2), and a temperature of Tsn = 42 K of Vela SNR photon field is obtained. We note that such a photon field around the nebula has not been detected by the current observations of Vela X, but this value is interestingly consistent with the supernova (SN) formed dust temperature for the young PWNe of 50 − 60 K estimated by Temim et al. (2012).
The photon field produced by synchrotron emission of the PWN also may prevent high energy photons from leaving the nebula. In order to study the effect of photon–photon annihilation of the synchrotron photon inside the PWN on the photon SEDs, we calculated the optical depths to the pair production with the parameters listed in Table 1 and the results are given in Fig. 3, where the optical depth to the SNR photon field is calculated with Eq. (12) and the optical depth to the synchrotron photon field of the PWN are determined by (e.g. Aharonian et al. 2008)
 (13)
(13)
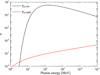 |
Fig. 3. Present-day optical depths to pair production of synchrotron photon field of the PWN (red line) and SNR photon field (black line), with the parameters listed in Table 1. |
where nγ(r, x, t) is the number density of non-thermal photons and σγγ represents the photon–photon annihilation cross section. It can be seen from Fig. 3 that the process of photon–photon annihilation of synchrotron photons inside the PWN can be neglected due to the optical depth τγγ−pwn ≪ τγγ−sn, and that the VHE γ-ray spectrum of Vela X is mainly modified by the photon–photon annihilation process of the SNR photon field.
To analyse the effect of the processes of synchrotron self-absorption and pair production on the photon spectrum, we also calculated the timescales of photon escape, synchrotron self-absorption, and pair production inside the PWN. The results are shown in Fig. 4. In the calculation, the photon escape timescale is calculated with tesc = Rpwn(t)/c, the timescale of photon–photon pair production tγγ inside the PWN is calculated by Eq. (28) of Lu et al. (2017a), and the synchrotron self-absorption timescale is given by (e.g. Mastichiadis & Kirk 1995)
![Mathematical equation: $$ \begin{aligned} t_{\rm ssa}=\left[-\sigma _{\rm T}c\frac{\pi }{6\alpha _f}x^{-1/2}b^{-1/2}\left[\frac{\partial }{\partial {\gamma }}\left(\frac{n_{\rm e}}{\gamma ^2}\right)\right]_{\gamma =(x/b)^{1/2}}\right]^{-1}, \end{aligned} $$](/articles/aa/full_html/2019/04/aa34320-18/aa34320-18-eq23.gif) (14)
(14)
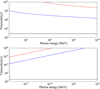 |
Fig. 4. Current timescales of photon escape (black lines), pair production (upper panel), and synchrotron self-absorption (bottom panel) inside the PWN at different radial distances of r = 3.9 arcmin (blue lines) and r = 66.8 arcmin (red lines). |
where αf is the fine-structure constant and b = B(r, t)/Bcr with the critical magnetic field Bcr. The results reveal that although the processes of synchrotron self-absorption and pair production inside the PWN are considered in the model, they can be neglected because of the timescales of tγγ ≪ tesc and tssa ≪ tesc in all of the emission regions. Therefore, the processes of synchrotron self-absorption and pair production inside the PWN only have little effect on the photon spectrum of Vela X.
With the parameters listed in Table 1, the high energy radiative spectra of Vela X are well reproduced at the age of 11.3 kyr. At this age, the present-day spin-down luminosity of the Vela pulsar is estimated to be 6.9 × 1036 erg s−1, which is consistent with the value given by Taylor et al. (1993). According to the model results, a fraction of pulsar spin-down power converted to magnetic energy is derived to be ηB = 0.0087, which implies that the current magnetic field of Vela X at the termination shock has a value of B0(Tage)=11.8 μG and a spatial average of  . The averaged magnetic field strength in our model is larger than the values of 5 μG obtained by de Jager et al. (2008) with a spatially independent model and 5.8 μG given by Porth et al. (2016) with a steady-state particle transport model. Moreover, with an initial diffusion coefficient of 9.0 × 1018 cm2 s−1, the current diffusion coefficient of Vela X at the termination shock is estimated to be κ0(Tage)=6.13 × 1023 cm2 s−1 and the spatial averaged diffusion coefficient has a value of
  with an electron energy of 1 TeV. These results are smaller than the values
  obtained by Porth et al. (2016), because the particle diffusion is energy independent in their model while it is energy dependent in our model.
The X-ray observations revealed that the photon index and flux density of Vela X in the 3 − 10 keV energy range increase with the increase of radial distance (Mangano et al. 2005). Thus, we calculated the variations of photon index and flux density with radial distance for the nebula according to the parameters listed in Table 1 and the results are shown in Fig. 5, where the fit residual is calculated with residual=(observation-model)/model. In the calculation, the observed data in the energy range of 3 − 10 keV of the emission region within r = 15 arcmin of the PWN are obtained from Mangano et al. (2005). It can be seen from Fig. 5 that the radial variations of photon index and flux density in this energy range can be well reproduced in the framework of our model when the emission regions are farther away from the central pulsar. While in the vicinity of the pulsar, the observed data cannot be reproduced well with our model, especially for the radial variations of the flux density, which have significant deviations between the data and the model. From the right panel of Fig. 5, it is clear that the flux density calculated with our model is less than the observed flux density of the inner emission regions. On the one hand, the particle distribution in the nebula is assumed to be isotropic and a toroidal magnetic field is adopted in our model, while the particle and magnetic field in the PWN may have more complicated distributions (e.g. Del Zanna et al. 2004; Porth et al. 2014). On the other hand, it could be that the observed data of the emission regions in the vicinity of the pulsar include photons that emit from the central pulsar, which leads to higher values of the observed flux density. The modelling results also show that the photon index and flux density of Vela X in the X-ray band have more significantly radial variations in the vicinity of the Vela pulsar, because the radial variations of magnetic field and diffusion in the inner regions are more obvious (Kennel & Coroniti 1984a; Lu et al. 2017b), and the SED shape in the X-ray band is determined by the competition between the radiation losses and particle diffusion (Vorster & Moraal 2013).
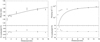 |
Fig. 5. Comparisons of radial variations of photon index (left panel) and flux density (right panel) in the energy range of 3 − 10 keV of the Vela X emission within r = 15 arcmin. The observed data are taken from Mangano et al. (2005). |
Based on deeper observations of the entire Vela X nebula region with H.E.S.S., Abramowski et al. (2012) have shown that the energy averaged surface brightness of the γ-ray emission of the nebula in the 0.75 − 70 TeV energy range has obvious changes as the radial distance increases. We calculated the differential γ-ray spectra of the inner region of r = 48 arcmin and ring extension of 48 < r < 72 arcmin of Vela X, as well as the averaged surface brightness in the 0.75 − 70 TeV energy range with the same model parameters. The results are shown in Fig. 6 and the observed data are taken from Abramowski et al. (2012). From the left panel of Fig. 6, it is clear that the γ-ray spectra of the inner region and ring extension of Vela X can be well reproduced in our model. The comparison of radial variations of the energy averaged surface brightness of the PWN in the 0.75 − 70 TeV energy range are shown in the right panel of Fig. 6, indicating that our model can also reproduce the decreased surface brightness. In our model, the nebula is assumed to be a spherical symmetric system and the particle distribution inside the nebula is considered to be isotropic, while the TeV γ-ray observations of H.E.S.S. revealed that Vela X is an asymmetric PWN, which leads the radial variations of surface brightness in the TeV band to have some deviations between the observations and the model.
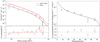 |
Fig. 6. Left panel: comparisons of differential γ-ray spectrum of the inner region of r = 48 arcmin (red line) and ring extension of 48 < r < 72 arcmin (black line) of Vela X in the TeV band. Right panel: radial variations of surface brightness in the 0.75 − 70 TeV energy range. The observed data are taken from Abramowski et al. (2012). |
The central position of VHE γ-ray emission of Vela X is not located at the location of the Vela pulsar because the view fields in the γ-rays revealed that the significant emissions are mainly centred on the south of the pulsar (Aharonian et al. 2006; Abramowski et al. 2012), which is different from that shown in the X-ray band. The observations have shown that the central position of X-ray emission is located at the location of the central pulsar (Mangano et al. 2005). We also note that the central position of GeV γ-ray emission is also not located at the location of the Vela pulsar but located at the south of the pulsar, and that it is not the same as the central position of the TeV γ-ray emission because the observed image in the GeV band is different from that in the TeV band (e.g. Abdo et al. 2010; Tibaldo et al. 2018). In our model, the particles are injected from the central pulsar, that is, the central position of photon emission is located at the location of the central pulsar. Therefore, the TeV γ-ray spectra of the inner region and ring extension of Vela X, as well as the radial variations of surface brightness in 0.75 − 70 TeV energy range, can be reproduced by our model, but they are somewhat different from the observations. In order to investigate the spatial radiative properties of Vela X more accurately at different bands, a non-spherically symmetric spatially dependent model that involves the proper motion of the pulsar should be presented, though it is outside of the scope of our paper.
Abramowski et al. (2012) have pointed out that the energy spectrum of Vela X in the 0.75 − 70 TeV energy range can be well described by an exponentially cut-off power-law function, dN/dE ∝ (E/1 TeV)−Γe−E/Ecut, where E is the energy of photons, Γ is the power-law photon index, and Ecut is the cut-off energy. In order to investigate the radial variations of the spectrum in the TeV band, we also calculated the photon index and cut-off energy of Vela X in the 0.75 − 70 TeV energy range with an exponentially cut-off power-law function, and the results are shown in Fig. 7. It can be seen from the left panel of Fig. 7 that the power-law photon index in the 0.75 − 70 TeV energy range remains almost unchanged as the radial distance increases. The radial variations of the cut-off energy are shown in the right panel of Fig. 7, showing that the cut-off energy decreases with the increase of radial distance in the inner regions, while there are only slight changes in the outer regions. In fact, the shape of the photon spectrum in the TeV band is determined by the competition between the radiation losses and particle diffusion (Vorster & Moraal 2013; Lu et al. 2016). In our model, the magnetic field decreases while the diffusion coefficient increases with the increasing time (see Eqs. (6) and (7)). For Vela X with an age of 11.3 kyr, the current competition between the radiation losses and particle diffusion has transitioned to a diffusion-dominated regime. Particle diffusion is important for reducing the amount of radiation losses (Vorster & Moraal 2013), which leads to the radial variations of photon index and cut-off energy in the TeV energy range as shown in Fig. 7.
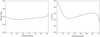 |
Fig. 7. Radial variations of photon index (left panel) and cut-off energy (right panel) of Vela X in the 0.75 − 70 TeV energy range. |
Finally, we calculated the radial variations of the power-law photon index and surface brightness of Vela X in the 0.2 − 20 GeV energy range, and the results are shown in Fig. 8. Abdo et al. (2010) have pointed out that the total GeV γ-ray spectrum in the energy range of 0.2 − 20 GeV can be well described by a power-law function with a photon index of 2.41 ± 0.09 ± 0.15. Thus, the radial photon index of our model in the GeV energy range is also calculated with a power-law function. From the left panel of Fig. 8, it can be seen that the photon index of the inner regions of Vela X in the GeV band has a significant increase as the radial distance increases, while there is only a slight changes in the outer regions. In the calculation, the injected particles of Vela X are composed of two distinct electron populations (see Eq. (3)) and GeV γ-rays are produced by the lower energy population, indicating that the power-law photon index in the 0.2 − 20 GeV energy range is also determined by the competition between the radiation losses and particle diffusion. In our model, the particle diffusion is energy dependent and the lower energy particles have a slow diffusion, which give rise to the radial variations of the photon index of Vela X in the GeV band being mainly determined by the radiation losses and leading to the variations of photon index in the 0.2 − 20 GeV energy range as shown in the left panel of Fig. 8. We would like to point out that the radial variations of the photon index of Vela X in the GeV band is different from the results of MSH 15-52, G21.5-0.9, and 3C58 obtained by Lu et al. (2017a,b). This is because the injected particles of Vela X are assumed to be composed of two distinct electron populations, while a broken power-law form is assumed for MSH 15-52, G21.5-0.9, and 3C58 in Lu et al. (2017a,b). The radial variations of surface brightness in the 0.2 − 20 GeV energy range are given in the right panel of Fig. 8. Similar to the radial variations of energy averaged surface brightness in the TeV band, the surface brightness of Vela X in the GeV energy range also decreases with the increase of radial distance. It should be pointed out that although the Fermi-LAT observations have revealed that the photon spectra of Vela X in the southern and northern wings have some differences (Grondin et al. 2013), the spatial variations of photon index and surface brightness at the GeV band have not been reported in the literature. Therefore, the spatial variations of Vela X in the GeV band predicted by our model should be tested in the further observations.
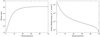 |
Fig. 8. Radial variations of power-law photon index (left panel) and surface brightness (right panel) of Vela X in the energy range of 0.2 − 20 GeV. |
3. Summary and discussion
In this paper, non-thermal photon emission and high energy spatially radiative properties of Vela X have been investigated in the framework of a spatially dependent particle transport model. The main difference between the model presented here and that given by Lu et al. (2017a) is that the injected particles are assumed to consist of two distinct electron populations and the γ-ray attenuation by the SNR photon fields is taken into account.
With the parameters listed in Table 1, the photon SEDs of Vela X observed at X-ray, GeV, and TeV γ-ray bands can be reproduced well in this model (see Fig. 2), and the process of γ-ray attenuation by the SNR photon fields is important for correcting the VHE γ-ray spectrum of Vela X (see right panel of Fig. 2), and the temperature of Vela SNR photon field is estimated to be 42 K.
The spatial variations of photon SEDs of Vela X also have been investigated. From our calculations, on the one hand, the radial variations of photon index and flux density of the emission region within r = 15 arcmin of Vela X in the 3 − 10 keV energy range are well reproduced in the model, with the exception of the data in the regions of the vicinity of the central pulsar (see Fig. 5). The difference between model results and the observed data may be that the observed data of the vicinity of the pulsar include the photons whose emission from the central pulsar and the particle distribution in the nebula is assumed to be isotropic and a toroidal magnetic filed is adopted in our model, while the particle and magnetic field in the PWN probably have more complicated distributions. On the other hand, the differential γ-ray spectra of the inner region of r = 48′ and ring extension of 48′< r < 72′ as well as the radial variations of averaged surface brightness of Vela X in the 0.75 − 70 TeV energy range can be reproduced well in the model (see Fig. 6).
The radial variations of the γ-ray spectrum in the 0.75 − 70 TeV energy range have been studied with an exponentially cut-off power-law function, indicating that the photon index of Vela X in the TeV band only has a slight change as the radial distance increases, and the cut-off energy decreases with the increase of radial distance in the inner regions but only has a slight change in the outer regions (see Fig. 7). Furthermore, the radial variations of the power-law photon index and surface brightness of Vela X in the 0.2 − 20 GeV energy range are also predicted, and the results show that the power-law photon index increases while the surface brightness decreases with the increase of radial distance (see Fig. 8). We note that the increased photon index of Vela X in the GeV band is different from the results of MSH 15-52, G21.5-0.9, and 3C58 obtained by Lu et al. (2017a); Lu et al. (2017b), because the injected particles of Vela X are assumed to be composed of two distinct electron populations and GeV γ-rays are produced by the lower energy population.
It should be pointed out that the particles in the model are injected from the central pulsar, which leads to the central position of photon emission of our model being located at the location of the pulsar. The observations showed that the central positions of GeV and TeV γ-ray emissions of Vela X are located at the south of the Vela pulsar (Aharonian et al. 2006; Abdo et al. 2010; Abramowski et al. 2012; Grondin et al. 2013; Tibaldo et al. 2018), and the central positions shown in the GeV and TeV bands are different. Therefore, although our model can roughly account for the high energy spatially radiative properties of Vela X, a non-spherically symmetric spatially dependent model, which includes the proper motion of the pulsar, should be presented to investigate the radiative properties of the PWN more precisely.
Acknowledgments
We are very grateful to the anonymous referee for his or her very constructive comments. This work is partially supported by the National Natural Science Foundation of China (NSFC 11433004, U1738211, 11173020, 11803027), Top Talents Program of Yunnan Province, and Yunnan local colleges applied basic research projects (2017FH001-17).
References
- Abdo, A. A., Ackermann, M., Ajello, M., et al. 2010, ApJ, 713, 146 [NASA ADS] [CrossRef] [Google Scholar]
- Abramowski, A., Acero, F., Aharonian, F., et al. 2012, A&A, 548, A38 [NASA ADS] [CrossRef] [EDP Sciences] [Google Scholar]
- Aharonian, F., Akhperjanian, A. G., Bazer-Bachi, A. R., et al. 2006, A&A, 448, L43 [NASA ADS] [CrossRef] [EDP Sciences] [Google Scholar]
- Aharonian, F. A., Khangulyan, D., & Costamante, L. 2008, MNRAS, 387, 1206 [NASA ADS] [CrossRef] [Google Scholar]
- Ajello, M., Atwood, W. B., Baldini, L., et al. 2017, ApJS, 232, 18 [NASA ADS] [CrossRef] [Google Scholar]
- Alvarez, H., Aparici, J., May, J., & Reich, P. 2001, A&A, 372, 636 [NASA ADS] [CrossRef] [EDP Sciences] [Google Scholar]
- Aschenbach, B., Egger, R., & Trümper, J. 1995, Nature, 373, 587 [NASA ADS] [CrossRef] [Google Scholar]
- Bucciantini, N., Bandiera, R., Blondin, J. M., Amato, E., & Del Zanna, L. 2004, A&A, 422, 609 [NASA ADS] [CrossRef] [EDP Sciences] [Google Scholar]
- Bucciantini, N., Arons, J., & Amato, E. 2011, MNRAS, 410, 381 [Google Scholar]
- Caraveo, P. A., De Luca, A., Mignani, R. P., & Bignami, G. F. 2001, ApJ, 561, 930 [NASA ADS] [CrossRef] [Google Scholar]
- de Jager, O. C., Slane, P. O., & LaMassa, S. 2008, ApJ, 689, L125 [NASA ADS] [CrossRef] [Google Scholar]
- Del Zanna, L., Amato, E., & Bucciantini, N. 2004, A&A, 421, 1063 [NASA ADS] [CrossRef] [EDP Sciences] [Google Scholar]
- Dermer, C. D., Murase, K., & Takami, H. 2012, ApJ, 755, 147 [NASA ADS] [CrossRef] [Google Scholar]
- Dodson, R., Legge, D., Reynolds, J. E., & McCulloch, P. M. 2003, ApJ, 596, 1137 [NASA ADS] [CrossRef] [Google Scholar]
- Espinoza, C. M., Lyne, A. G., & Stappers, B. W. 2017, MNRAS, 466, 147 [NASA ADS] [CrossRef] [Google Scholar]
- Grondin, M.-H., Romani, R. W., Lemoine-Goumard, M., et al. 2013, ApJ, 774, 110 [NASA ADS] [CrossRef] [Google Scholar]
- Helfand, D. J., Gotthelf, E. V., & Halpern, J. P. 2001, ApJ, 556, 380 [NASA ADS] [CrossRef] [Google Scholar]
- Hinton, J. A., Funk, S., Parsons, R. D., & Ohm, S. 2011, ApJ, 743, L7 [NASA ADS] [CrossRef] [Google Scholar]
- Holler, M., Schöck, F. M., Eger, P., et al. 2012, A&A, 539, A24 [NASA ADS] [CrossRef] [EDP Sciences] [Google Scholar]
- Horns, D., Aharonian, F., Santangelo, A., Hoffmann, A. I. D., & Masterson, C. 2006, A&A, 451, L51 [NASA ADS] [CrossRef] [EDP Sciences] [Google Scholar]
- Ishizaki, W., Tanaka, S. J., Asano, K., & Terasawa, T. 2017, ApJ, 838, 142 [NASA ADS] [CrossRef] [Google Scholar]
- Kennel, C. F., & Coroniti, F. V. 1984a, ApJ, 283, 694 [NASA ADS] [CrossRef] [Google Scholar]
- Kennel, C. F., & Coroniti, F. V. 1984b, ApJ, 283, 710 [NASA ADS] [CrossRef] [Google Scholar]
- LaMassa, S. M., Slane, P. O., & de Jager, O. C. 2008, ApJ, 689, L121 [NASA ADS] [CrossRef] [Google Scholar]
- Large, M. I., Vaughan, A. E., & Mills, B. Y. 1968, Nature, 220, 340 [NASA ADS] [CrossRef] [Google Scholar]
- Lerche, I., & Schlickeiser, R. 1981, ApJS, 47, 33 [NASA ADS] [CrossRef] [Google Scholar]
- Lu, F.-W., Gao, Q.-G., & Zhang, L. 2016, Res. Astron. Astrophys., 16, 90 [NASA ADS] [CrossRef] [Google Scholar]
- Lu, F.-W., Gao, Q.-G., & Zhang, L. 2017a, ApJ, 834, 43 [NASA ADS] [CrossRef] [Google Scholar]
- Lu, F.-W., Gao, Q.-G., Zhu, B.-T., & Zhang, L. 2017b, MNRAS, 472, 2926 [NASA ADS] [CrossRef] [Google Scholar]
- Lyne, A. G., Pritchard, R. S., Graham-Smith, F., & Camilo, F. 1996, Nature, 381, 497 [NASA ADS] [CrossRef] [Google Scholar]
- Mangano, V., Massaro, E., Bocchino, F., Mineo, T., & Cusumano, G. 2005, A&A, 436, 917 [NASA ADS] [CrossRef] [EDP Sciences] [Google Scholar]
- Manzali, A., De Luca, A., & Caraveo, P. A. 2007, ApJ, 669, 570 [Google Scholar]
- Markwardt, C. B., & Ögelman, H. 1995, Nature, 375, 40 [NASA ADS] [CrossRef] [Google Scholar]
- Markwardt, C. B., & Ögelman, H. B. 1997, ApJ, 480, L13 [NASA ADS] [CrossRef] [Google Scholar]
- Mastichiadis, A., & Kirk, J. G. 1995, A&A, 295, 613 [NASA ADS] [Google Scholar]
- Mattana, F., Götz, D., Terrier, R., et al. 2011, ApJ, 743, L18 [Google Scholar]
- Murase, K., Kashiyama, K., Kiuchi, K., & Bartos, I. 2015, ApJ, 805, 82 [NASA ADS] [CrossRef] [Google Scholar]
- Ng, C. K., & Gleeson, L. J. 1975, Sol. Phys., 43, 475 [NASA ADS] [CrossRef] [Google Scholar]
- Ng, C.-Y., & Romani, R. W. 2004, ApJ, 601, 479 [NASA ADS] [CrossRef] [Google Scholar]
- Pacini, F., & Salvati, M. 1973, ApJ, 186, 249 [NASA ADS] [CrossRef] [Google Scholar]
- Porth, O., Komissarov, S. S., & Keppens, R. 2014, MNRAS, 438, 278 [NASA ADS] [CrossRef] [Google Scholar]
- Porth, O., Vorster, M. J., Lyutikov, M., & Engelbrecht, N. E. 2016, MNRAS, 460, 4135 [NASA ADS] [CrossRef] [Google Scholar]
- Reichley, P. E., Downs, G. S., & Morris, G. A. 1970, ApJ, 159, [Google Scholar]
- Taylor, J. H., Manchester, R. N., & Lyne, A. G. 1993, ApJS, 88, 529 [NASA ADS] [CrossRef] [Google Scholar]
- Temim, T., Slane, P., Arendt, R. G., & Dwek, E. 2012, ApJ, 745, 46 [NASA ADS] [CrossRef] [Google Scholar]
- Tibaldo, L., Zanin, R., Faggioli, G., et al. 2018, A&A, 617, A78 [NASA ADS] [CrossRef] [EDP Sciences] [Google Scholar]
- Truelove, J. K., & McKee, C. F. 1999, ApJS, 120, 299 [NASA ADS] [CrossRef] [Google Scholar]
- van Rensburg, C., Krüger, P. P., & Venter, C. 2018, MNRAS, 477, 3853 [NASA ADS] [CrossRef] [Google Scholar]
- Vorster, M. J., & Moraal, H. 2013, ApJ, 765, 30 [NASA ADS] [CrossRef] [Google Scholar]
- Weiler, K. W., & Panagia, N. 1980, A&A, 90, 269 [NASA ADS] [Google Scholar]
- Zhang, L., & Yang, X. C. 2009, ApJ, 699, L153 [NASA ADS] [CrossRef] [Google Scholar]
All Tables
All Figures
|
Fig. 1. Dynamical evolution radius of SNR (Rsnr, purple line), reverse shock (Rrs, green line), PWN (Rpwn, black line) and the termination shock (Rts, blue line). The stars represent the current radius and terminate shock radius of Vela PWN at Tage = 11.3 kyr. |
| In the text | |
|
Fig. 2. Comparison of modelling results of Vela X with the observed data at different emission regions of r = 6 arcmin (dark-yellow line), r = 15 arcmin (red line), and r = 48 arcmin (blue line), as well as the total flux (black line). Left panel: modelling SEDs from radio to γ-ray bands. Right panel: modelling SEDs in the γ-ray band. The dash-dotted lines are the unabsorbed spectra, and the solid lines consider γ-ray attenuation by the SNR photon fields. The observed data are taken from Abdo et al. (2010) for radio band (black, full circles), Mattana et al. (2011) and Mangano et al. (2005) for X-rays of the inner regions of r = 6 arcmin (dark-yellow, solid thick line) and r = 15 arcmin (red, solid thick line), Grondin et al. (2013), Ajello et al. (2017), and Tibaldo et al. (2018) for GeV γ-rays (black, open circles), and Abramowski et al. (2012) for TeV γ-rays emission within r = 48 arcmin (blue, full circles), respectively. |
| In the text | |
|
Fig. 3. Present-day optical depths to pair production of synchrotron photon field of the PWN (red line) and SNR photon field (black line), with the parameters listed in Table 1. |
| In the text | |
|
Fig. 4. Current timescales of photon escape (black lines), pair production (upper panel), and synchrotron self-absorption (bottom panel) inside the PWN at different radial distances of r = 3.9 arcmin (blue lines) and r = 66.8 arcmin (red lines). |
| In the text | |
|
Fig. 5. Comparisons of radial variations of photon index (left panel) and flux density (right panel) in the energy range of 3 − 10 keV of the Vela X emission within r = 15 arcmin. The observed data are taken from Mangano et al. (2005). |
| In the text | |
|
Fig. 6. Left panel: comparisons of differential γ-ray spectrum of the inner region of r = 48 arcmin (red line) and ring extension of 48 < r < 72 arcmin (black line) of Vela X in the TeV band. Right panel: radial variations of surface brightness in the 0.75 − 70 TeV energy range. The observed data are taken from Abramowski et al. (2012). |
| In the text | |
|
Fig. 7. Radial variations of photon index (left panel) and cut-off energy (right panel) of Vela X in the 0.75 − 70 TeV energy range. |
| In the text | |
|
Fig. 8. Radial variations of power-law photon index (left panel) and surface brightness (right panel) of Vela X in the energy range of 0.2 − 20 GeV. |
| In the text | |
Current usage metrics show cumulative count of Article Views (full-text article views including HTML views, PDF and ePub downloads, according to the available data) and Abstracts Views on Vision4Press platform.
Data correspond to usage on the plateform after 2015. The current usage metrics is available 48-96 hours after online publication and is updated daily on week days.
Initial download of the metrics may take a while.