Fig. 2.
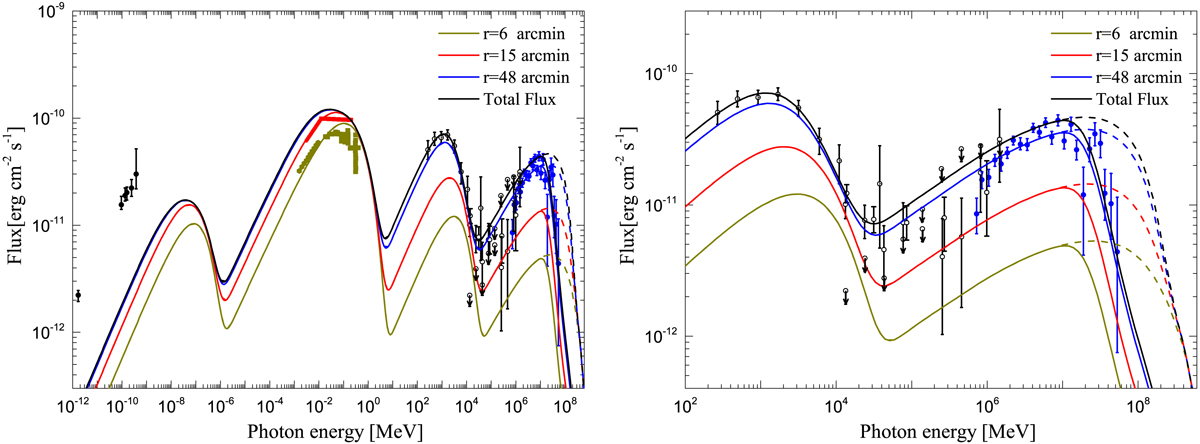
Comparison of modelling results of Vela X with the observed data at different emission regions of r = 6 arcmin (dark-yellow line), r = 15 arcmin (red line), and r = 48 arcmin (blue line), as well as the total flux (black line). Left panel: modelling SEDs from radio to γ-ray bands. Right panel: modelling SEDs in the γ-ray band. The dash-dotted lines are the unabsorbed spectra, and the solid lines consider γ-ray attenuation by the SNR photon fields. The observed data are taken from Abdo et al. (2010) for radio band (black, full circles), Mattana et al. (2011) and Mangano et al. (2005) for X-rays of the inner regions of r = 6 arcmin (dark-yellow, solid thick line) and r = 15 arcmin (red, solid thick line), Grondin et al. (2013), Ajello et al. (2017), and Tibaldo et al. (2018) for GeV γ-rays (black, open circles), and Abramowski et al. (2012) for TeV γ-rays emission within r = 48 arcmin (blue, full circles), respectively.
Current usage metrics show cumulative count of Article Views (full-text article views including HTML views, PDF and ePub downloads, according to the available data) and Abstracts Views on Vision4Press platform.
Data correspond to usage on the plateform after 2015. The current usage metrics is available 48-96 hours after online publication and is updated daily on week days.
Initial download of the metrics may take a while.