| Issue |
A&A
Volume 624, April 2019
|
|
|---|---|---|
| Article Number | A2 | |
| Number of page(s) | 5 | |
| Section | Planets and planetary systems | |
| DOI | https://doi.org/10.1051/0004-6361/201834254 | |
| Published online | 29 March 2019 | |
Tidal heating and the habitability of the TRAPPIST-1 exoplanets
1
Konkoly Observatory, Research Centre for Astronomy and Earth Sciences, Hungarian Academy of Sciences,
Konkoly Thege Miklós út 15-17,
1121 Budapest,
Hungary
e-mail: This email address is being protected from spambots. You need JavaScript enabled to view it.
2
Geodetic and Geophysical Institute, Research Centre for Astronomy and Earth Sciences, Hungarian Academy of Sciences,
Csatkai Endre u. 6-8,
9400 Sopron, Hungary
3
Tempus Public Foundation,
Kéthly Anna tér 1,
1077 Budapest, Hungary
4
Gothard Astrophysical Observatory, ELTE Eötvös Loránd University, Szombathely,
Szent Imre h. u. 112, Hungary
5
Planetary Science Institute,
1700 E. Ft. Lowell, Suite 106, Tucson,
AZ 85719, USA
6
Sydney Institute for Astronomy, School of Physics A28, University of Sydney, Sydney, NSW 2006, Australia
Received:
17
September
2018
Accepted:
10
February
2019
Abstract
Context. New estimates of the masses and radii of the seven planets orbiting the ultracool M-dwarf TRAPPIST-1 star permit improved modelling of their compositions, heating by tidal dissipation, and removal of tidal heat by solid-state convection.
Aims. Here we compute the heat flux due to insolation and tidal heating for the inner four planets.
Methods. We apply a Maxwell viscoelastic rheology to compute the tidal response of the planets using the volume-weighted average of the viscosities and rigidities of the metal, rock, high-pressure ice, and liquid water/ice I layers.
Results. We show that TRAPPIST-1d and e can avoid entering a runaway greenhouse state. Planet e is the most likely to support a habitable environment, with Earth-like surface temperatures and possibly liquid water oceans. Planet d also avoids a runaway greenhouse, if its surface reflectance is at least as high as that of the Earth. Planets b and c, closer to the star, have heat fluxes high enough to trigger a runaway greenhouse and to support volcanism on the surfaces of their rock layers, rendering them too warm for life. Planets f, g, and h are too far from the star to experience significant tidal heating, and likely have solid ice surfaces with possible subsurface liquid water oceans.
Key words: planets and satellites: interiors / planets and satellites: terrestrial planets / methods: numerical / astrobiology
Hungarian Eötvös Fellow.
© ESO 2019
1 Introduction
The ultracool M-dwarf star TRAPPIST-1 appears to harbour seven roughly Earth-sized planets, among which planets d, e, f, and g may potentially be habitable (Gillon et al. 2017; Papaloizou et al. 2018; Unterborn et al. 2018; Barr et al. 2018). Prior works have addressed habitability in terms of stellar activity, water loss, and implications of tidal locking (Vida et al. 2017; Garraffo et al. 2017; Bourrier et al. 2017; Checlair et al. 2017; Dong et al. 2018; Turbet et al. 2018), but none has addressed the role of the planets’ interior geodynamics in maintaining a habitable environment. Planets can be habitable only if they avoid entering a “runaway greenhouse” state, in which a high geothermal and/or solar heat flux causes all of their surface water to evaporate irreversibly into a thick atmosphere (Kasting et al. 1993).
A planet that experiences a runaway greenhouse effect is generally not considered to be habitable because its water has evaporated and been split into hydrogen and oxygen in the planet’s upper atmosphere by photodissociation (Kasting et al. 1993). The hydrogen molecules can easily escape to space, and as a consequence water molecules cannot re-form, even if the planet’s temperature later decreases. A planet may enter a runaway greenhouse state if its net heat flux, Fglob, exceeds a critical energy flux, FRG, at the top of a water-rich atmosphere. To determine if a runaway greenhouse state is likely for any of the TRAPPIST-1 planets, we compare FRG to the global heat flux from the planet Fglob = F⋆ + Fint, where F⋆ is the energy received from sunlight, and Fint is the heat flux from the planet’s interior.
The TRAPPIST-1 planets are heated from within by tidal dissipation (Barr et al. 2018), which is the dominant contribution to Fint. To determine Fint, we equate the heating rate from tidal dissipation to the heat flux from solid-state convection (Barr et al. 2018), the dominant mode of removing heat from the deep interior of a solid planet (Solomatov & Moresi 2000). The planets orbit close to the parent star in eccentric orbits, and experience a time-variable tidal gravitational force from the star. Tidal forces raise and lower a bulge on each planet; as the height of the bulge changes, the planet does work against its own internal rigidity resulting in the dissipation of orbital energy in the planet’s interior (Peale & Cassen 1978). This phenomenon is responsible for the prodigious volcanism on Jupiter’s moon Io (Peale et al. 1979) and cryovolcanism on Saturn’s moon Enceladus (Porco et al. 2006).
Applying N-body simulations to planets in the TRAPPIST-1 system, Luger et al. (2017) showed that due to tidal damping, the orbital eccentricities quickly decrease to values lower than 0.01, but the orbits do not circularise because of planet–planet interactions. The resonance chain maintains the eccentricities of the TRAPPIST-1 planets, similarly to the case of the three Galilean moons in the solar system (Io, Europa, Ganymede). The non-circularising orbits have a key role in maintaining tidal heat generation on long timescales.
The tidal heating rate for each planet depends strongly on its composition and temperature (Segatz et al. 1988). Ice, rock, and iron arethe most likely planetary materials (Gillon et al. 2017; Unterborn et al. 2018; Grimm et al. 2018); each behaves differently in response to time-variable tidal stresses. The response of each material is also sensitively dependent on its temperature. The temperature in the planet’s interior is controlled by the balance between tidal heat generation and heat transport (Barr et al. 2018; Henning et al. 2009; Dobos & Turner 2015).
2 Methods
To evaluate Fint, we computethe tidal response of each planet assuming it is composed of a mixture of H2 O, metal, and rock, using a Maxwell viscoelastic rheology characterised by a single uniform viscosity and rigidity for the planet given by the volume-weighted average of the viscosities and rigidities of each material (Barr et al. 2018; Henning et al. 2009). The tidal heating rate is set equal to the heat flux from solid-state convection across the planet’s rock mantle (Barr et al. 2018; Solomatov & Moresi 2000). We consider tidal heating in the planets’ rock mantles to be the dominant source of heat in the planets at this time, and solid-state convection as the means by which this heat is transported. We do not include other heat sources such as radiogenic heating, or residual heat from accretion or differentiation. If the abundances of heat-producing elements in the TRAPPIST-1 planets are similar to those in the planets in our solar system, tidal heating will be much greater than radiogenic heating (Frank et al. 2014), especially considering the age of the system ( ~8 Gyr; Burgasser & Mamajek 2017). We search for the rock mantle temperature (Teq ) at which the tidal heating rate is equal to the convective heating rate. The tidal heat flux evaluated at Teq is equal to Fint . This approach reproduces the spacecraft-measured value of tidal heat flux and estimated interior temperatures for Jupiter’s moon Io to better than 20% (Barr et al. 2018). Because the masses and radii of the planets still have uncertainties at the ~10% level (Grimm et al. 2018; Delrez et al. 2018), a variety of bulk compositions and interior structures are possible (see Fig. 1). We explore a range of interior structures and compositions assuming that each planet is composed of uniform-density (incompressible) iron, compressed Bridgmanite (MgSiO3) as a proxy for silicate rock, high-pressure ice polymorphs, and ice I/liquid water (Barr et al. 2018).
The planetary parameters are summarised in Table 1. The critical heat flux for a runaway greenhouse state, FRG , is calculated using the formulation of Pierrehumbert (2010; see also Barr et al. 2018). The heat flux from stellar radiation can be written as
 (1)
(1)
where L⋆ = 5.24 × 10⁻⁴ L⊙ is the stellar luminosity, AB is the Bond albedo of the planet, and a and e are the semi-major axis and the eccentricity of the planet’s orbit, respectively. In the calculations the uncertainties in the semi-major axis (a) andeccentricity (e) are not taken into account. Greenhouse and cloud feedbacks were neglected in the calculation of F⋆ . We use three Bond albedo values for each planet: 0.1, 0.3 (an Earth-like value), and 0.5.
We use Preliminary reference Earth model (PREM) values for the densities of iron (ρi = 12 000 kg m−3) and rock (ρr = 5000 kg m−3; Dziewonski & Anderson 1981), a representative density for the compressed ice phases (high-pressure polymorphs, or hpp) ρhpp = 1300 kg m−3 (Hobbs 1974), and ρiw = 1000 kg m−3 for ice I andliquid water. For each possible planetary mass and radius, we compute a suite of values for the volume fractions (ϕ) of ice I/water, hpp ice, rock, and metal that satisfy

where ρ is the mean density of the planet. If ρ < ρr, the planet must contain H2O in some form. For each water-bearing structure, ϕiw is estimated by determining the thickness of the low-density ice I (or possibly water) layer at the surface, z209 ≈ (209 MPa)∕(ρiwg), where 209 MPa is the pressure at which water undergoes the phase transition to the high-pressure ice polymorphs, and  . The planetary radius at which the phase transition occurs, Riw ≈ Rpl − z209, which gives
  . We explore a range of ϕ values for each of the remaining components to determine which values satisfy Eqs. (2) and (3).
The tidal heat flux Ftidal is calculated using a viscoelastic model for a homogeneous body with a strongly temperature-dependent viscosity η and shear modulus μ, constructed to mimic the effect of a layered planet (Barr et al. 2018):

Governing parameters for the rheologies of each material can be found in Barr et al. (2018). The viscosity and shear modulus for rock are calculated assuming a dunite composition (Berckhemer et al. 1982; Henning et al. 2009; Karato et al. 1995; Solomatov & Moresi 2000). The viscosity of rock is calculated under the assumption that the rock is dry and deforms under diffusion creep (Karato et al. 1995; Solomatov & Moresi 2000). The viscosity and rigidity of each material depends strongly on temperature, and both include the effect of melt. As the melt fraction increases, the viscosity and rigidity of each material decreases, giving a concomitant decrease in the amount of tidal heating (Henning et al. 2009). In our model, in each planet, tidal heating is maximised at the temperature at which the ratio between the viscosity and rigidity, the Maxwell time, is equal to the orbital period of the planet: η(T)∕μ(T) ≈ Torbit (Segatz et al. 1988). For TRAPPIST-1b through e, this occurs at Teq ~ 1600 K for the viscosity and rigidity parameters used here and in our prior study (Barr et al. 2018). Of course, this can depend on the choice of viscosity and rigidity parameters (e.g. dry vs. wet rheologies) and on the choice of rheological model (e.g. Maxwell, standard linear solid, Andrade, etc.; see Henning et al. 2009 for a full discussion of these effects). We neglect the viscosity and rigidity of iron because the tidal deformation of the planets’ iron cores will be negligible due to the restoring force imposed by the rock and ice mantle that lies on top of the core in each body (Henning et al. 2009). Tidal dissipation in the iron portion of the Earth is a small contributor to our planet’s global heat flux, providing only 1% of the total global heat flux (Lay et al. 2008). The tidal heat flux can be written as
 (6)
(6)
with orbital frequency ω = 2π∕P, orbital period P, and eccentricity e, and  (Segatz et al. 1988)
 (7)
(7)
The planet’s resistance to tidal deformation is described by a complex shear modulus μ* = M1 + iM2, where  , M1 =
  ,
,  , and C = μT2 +
  (Peltier 1974). The tidal heat generated inside the planet is transported to the surface by solid-state convection (Solomatov & Moresi 2000; Barr et al. 2018). The convective heat flux is calculated using scaling relationships for stagnant lid convection in internally heated rock mantles (Solomatov & Moresi 2000; Barr et al. 2018),
 (8)
(8)
with gas constant RG = 8.314 J mol−1 K, planetary surface gravity g = GM∕R, activation energy for volume diffusion in rock Q* = 300 J mol−1, coefficient of thermal expansion α = 3 × 10⁻⁵ K−1 , rock thermal conductivity ktherm = 3.2 W m−1 K−1, thermal diffusivity κtherm = ktherm∕ρrCp, rock specific heat Cp = 1200 J kg−1 (Solomatov & Moresi 2000), and rock viscosity ηr (Barr et al. 2018).
Uncertainties on the geothermal and the critical runaway greenhouse heat fluxes arise from uncertainties on the planetary masses and radii. Uncertainties on the values of tidal and global heat fluxes additionally arise from different possible values of albedo and orbital eccentricity. The uncertainties quoted here for our Teq arise from the different possible interior structures, namely the uncertainties on the volume fractions of different materials. A further source of uncertainty is the rheology appropriate for rock: if the rock in a planet’s interior is hydrated, the viscosity and rigidity can be altered, which can affect the value of Teq . Compared to previous findings (Barr et al. 2018), all planets except for planet d have weaker tidal heating as a result of new constraints on their physical and orbital parameters.
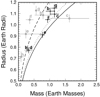 |
Fig. 1 Most recent planetary masses and radii (Grimm et al. 2018; Delrez et al. 2018, black), compared to prior estimates from Wang et al. (2017, grey). Most of the planets could contain ice, rock, and metal: 75% ice by mass, with 12.5% rock and 12.5% iron (dashed line); pure rock (dotted); or 50% rock by mass, with 25% iron, and 25% ice (solid curve). |
Parameters of the TRAPPIST-1 planets.
3 Results
Figure 2 illustrates the values of the volume fraction ϕ that are possible for each material, for planets b through e, as well as fiducial interior structures for each body. Similarly, Fig. 3 shows thepossible interior structures for the outer three planets. The width of the coloured region originates from the uncertainties on the mass and radius estimates of the planets; the top right (bottom left) part of this area includes the high-density (low-density) cases for each planet, as indicated in panel B. The vast majority of valid interior structures for all the planets include significant H2 O. Despite its proximity to the star, planet b must contain at least 0.2% H2 O by volume, consistent with prior predictions (Unterborn et al. 2018; Barr et al. 2018; Wang et al. 2017; Grimm et al. 2018), and we also find the vast majority of the possible structures for planet b have substantial quantities of water (~ 20−70%). The remaining planets are also probably water-rich, most notably planet d, where a volume fraction of H2 O ≳ 0.25 is required by the mass and radius data.
Table 2 summarises the values of Teq, Ftidal, FRG, and Fglob for planets b through e. Planets d and e have a total heat flux from tidal heating and insolation that is below the critical heat flux for a runaway greenhouse effect, and could be potentially habitable from a geophysical point of view. Planet d avoids a runaway greenhouse effect only if its Bond albedo is greater than or approximately equal to 0.3, indicating a surface at least as reflective as the surface of the Earth, which could be possible if the planet has a thick atmosphere with highly reflective clouds (Turbet et al. 2018). In this case, planet d could have liquid water at its surface at the substellar point provided it is tidally locked in a 1:1 spin–orbit resonance (Turbet et al. 2018). It is not clear whether TRAPPIST-1d is synchronously rotating because perturbations from the other planets may prevent tidal locking which results in a larger illuminated area where surface ice can melt (Vinson & Hansen 2017). Since the planet is close to the runaway greenhouse state due tothe received stellar irradiation, the moderate tidal heating rate that is present in the body might transform itinto a “tidal Venus” (Barnes et al. 2013). We find that planet e avoids a runaway greenhouse effect regardless of its albedo, bolstering the already strong case for its habitability based solely on climate modelling (Wolf 2017; Turbet et al. 2018). Planet e can maintain global surface oceans through greenhouse warming from H2 O alone (Turbet et al. 2018); alternatively, Earth-like temperatures can be maintained with an atmosphere of 1 bar of N2 and 0.4 bar CO2, or a pure CO2 atmosphere with a pressure of 1.3 bar (Wolf 2017).
If planets d or e were ice-covered, they could still sustain biospheres fueled by the planet’s interior tidal dissipation, for example clustered around hydrothermal vents at the top of the internally heated rock layer, as has been suggested for Jupiter’s moon Europa (Vance et al. 2007). Since both planets have equilibrium rock mantle temperatures greater than the melting point of silicate minerals, heat dissipation from the rock layer can locally melt the high-pressure ice to provide a warmer environment where the rock interacts with water through the vents and might support simple chemoautolithotropic life (Vance et al. 2007). The surface ice layer would shield the biosphere from the strong stellar flare activity of the TRAPPIST-1 star (Vida et al. 2017; Garraffo et al. 2017), but would serve as a barrier to detection of the biosphere through telescopic observations. Hydrothermal activity would be more pronounced on planet d, whose equilibrium temperatures can be as high as 1660 K, indicating the mantle could have as much as 35% melt by volume (McKenzie & Bickle 1988), similar to Io’s asthenosphere (Barr et al. 2018). The volume fraction of melt in the rock mantle of planet e would be more modest, less than 10% (McKenzie & Bickle 1988), which might not lend itself to efficient extraction by volcanism.
Planets b and c have heat flows far in excess of that required to trigger a runaway greenhouse effect. The apparent H2 O-rich composition of planet b seems to be at odds with a thick atmosphere given how quickly atmospheres may be stripped from the planets due to their proximity to the star (Wolf 2017). One explanation is that the planets only recently migrated to their present orbital configuration (Unterborn et al. 2018). The heat flows on both bodies are similar to that observed on Io (~ 1–2 W m−2; Spencer et al. 2000; Veeder et al. 2004), and correspondingly the planets have high mantle temperatures suggestive of melt-rich asthenospheres that could drive extensive volcanic activity (Barr et al. 2018).
According to our model, planets f, g, and h are too far from the TRAPPIST-1 star to experience significant tidal effects from the star and are likely covered with thick ice layers at their surfaces (Barr et al. 2018). The presence of an atmosphere does not modify these conclusions: any atmosphere on these bodies would quickly condense ontheir cold surfaces (Wolf 2017). Planet–planet interactions (which were not considered in this work) and the existing mean motion resonances between the planets, however, could contribute to the tidal heating rates considerably, especially in planet g, assuming that the planets are tidally locked to the star (Wright 2018; Lingam & Loeb 2018).Given that every large body in our solar system with a thick ice mantle also harbours a liquid water ocean (Hussmann et al. 2006), it seems likely that the planets, even with ice surfaces, would have liquid water oceans beneath kilometers of ice. Our model considers tidal heating to occur mainly in the rock mantles of the planets; a layered tidal model that partitions dissipation in each layer of the planet based on its rheology could shed more light on possible tidal heating in the outer three planets in the system (e.g. Roberts & Nimmo 2008). Better constrained radius and mass measurements are also critical for the characterisation of planetary interiors since the H2 O content of the bodies greatly depends on these estimates (Dorn et al. 2018).
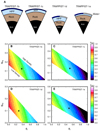 |
Fig. 2 Compositions and interior structures of planets TRAPPIST-1b through e. Panel A: representative possible interior structures of planets b through e, with layers of liquid water (dark blue), high-pressure ice polymorphs(light blue), rock (brown), and iron (black). Planets d and e are far enough from the TRAPPIST-1 star topotentially have a layer of solid ice (white) on their surfaces. Panels B–E: compositions of planets b through e, where the colour-coding indicates the volume fraction of H2 O permitted in each planet (ϕH2O = ϕiw + ϕhpp) as a functionof its volume fraction of iron (ϕFe) and rock (ϕr). Black stars indicate the cases shown in panel A. Planets b and d are substantially more H2 O-rich than planets c and e. |
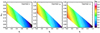 |
Fig. 3 Same as panels B–E of Fig. 2, but for TRAPPIST-1f, g, and h. The colour-coding indicates the volume fraction of H2O permitted in each planet (ϕH2O) as a functionof the volume fraction of iron (ϕFe) and rock (ϕr). |
Resulting fluxes and equilibrium temperature for the inner four planets.
Acknowledgements
We thank the referee for the useful questions and comments. V.D. thanks the Max Planck Institute for Solar System Research for providing a work environment. V.D. is supported by Hungarian National Research, Development, and Innovation Office (NKFIH) grants K-119993, K-115709, and GINOP-2.3.2-15-2016-00003. A.C.B. acknowledges support from NASA Habitable Worlds Program 80NSSC18K0136. This work has been partially funded by the Tempus Public Foundation, project number 156411.
References
- Barnes, R., Mullins, K., Goldblatt, C., et al. 2013, Astrobiology, 13, 225 [NASA ADS] [CrossRef] [Google Scholar]
- Barr, A. C., Dobos, V., & Kiss, L. L. 2018, A&A, 613, A37 [NASA ADS] [CrossRef] [EDP Sciences] [Google Scholar]
- Berckhemer, H., Kampfmann, W., Aulbach, E., & Schmeling, H. 1982, Phys. Earth Planet. Inter., 29, 30 [NASA ADS] [CrossRef] [Google Scholar]
- Bourrier, V., de Wit, J., Bolmont, E., et al. 2017, AJ, 154, 121 [NASA ADS] [CrossRef] [Google Scholar]
- Burgasser, A. J., & Mamajek, E. E. 2017, ApJ, 845, 110 [NASA ADS] [CrossRef] [Google Scholar]
- Checlair, J., Menou, K., & Abbot, D. S. 2017, ApJ, 845, 132 [NASA ADS] [CrossRef] [Google Scholar]
- Delrez, L., Gillon, M., Triaud, A., et al. 2018, MNRAS, 475, 3577 [NASA ADS] [CrossRef] [Google Scholar]
- Dobos, V., & Turner, E. L. 2015, ApJ, 804, 41 [NASA ADS] [CrossRef] [Google Scholar]
- Dong, C., Jin, M., Lingam, M., et al. 2018, Proc. Natl. Acad. Sci., 115, 260 [NASA ADS] [CrossRef] [Google Scholar]
- Dorn, C., Mosegaard, K., Grimm, S. L., & Alibert, Y. 2018, ApJ, 865, 20 [NASA ADS] [CrossRef] [Google Scholar]
- Dziewonski, A. M., & Anderson, D. L. 1981, Phys. Earth Planet. Inter., 25, 297 [NASA ADS] [CrossRef] [Google Scholar]
- Frank, E. A., Meyer, B. S., & Mojzsis, S. J. 2014, Icarus, 243, 274 [NASA ADS] [CrossRef] [Google Scholar]
- Garraffo, C., Drake, J. J., Cohen, O., Alvarado-Gomez, J. D., & Moschou, S. P. 2017, ApJ, 843, L33 [NASA ADS] [CrossRef] [Google Scholar]
- Gillon, M., Triaud, A. H. M. J., Demory, B.-O., et al. 2017, Nature, 542, 456 [NASA ADS] [CrossRef] [PubMed] [Google Scholar]
- Grimm, S. L., Demory, B.-O., Gillon, M., et al. 2018, A&A, 613, A68 [NASA ADS] [CrossRef] [EDP Sciences] [Google Scholar]
- Henning, W. G., O’Connell, R. J., & Sasselov, D. D. 2009, ApJ, 707, 1000 [NASA ADS] [CrossRef] [Google Scholar]
- Hobbs, P. V. 1974, Ice Physics (Oxford: Oxford University Press) [Google Scholar]
- Hussmann, H., Sohl, F., & Spohn, T. 2006, Icarus, 185, 258 [NASA ADS] [CrossRef] [Google Scholar]
- Karato, S.-I., Zhang, S., & Wenk, H.-R. 1995, Science, 270, 458 [NASA ADS] [CrossRef] [Google Scholar]
- Kasting, J. F., Whitmire, D. P., & Reynolds, R. T. 1993, Icarus, 101, 108 [NASA ADS] [CrossRef] [PubMed] [Google Scholar]
- Lay, T., Hernlund, J., & Buffett, B. A. 2008, Nat. Geosci., 1, 25 [NASA ADS] [CrossRef] [Google Scholar]
- Lingam, M., & Loeb, A. 2018, Astrobiology, 18, 967 [NASA ADS] [CrossRef] [Google Scholar]
- Luger, R., Sestovic, M., Kruse, E., et al. 2017, Nat. Astron., 1, 0129 [Google Scholar]
- McKenzie, D., & Bickle, M. 1988, J. Petrol., 29, 625 [NASA ADS] [CrossRef] [Google Scholar]
- Papaloizou, J. C. B., Szuszkiewicz, E., & Terquem, C. 2018, MNRAS, 476, 5032 [NASA ADS] [CrossRef] [Google Scholar]
- Peale, S. J., & Cassen, P. 1978, Icarus, 36, 245 [NASA ADS] [CrossRef] [Google Scholar]
- Peale, S. J., Cassen, P., & Reynolds, R. T. 1979, Science, 203, 892 [NASA ADS] [CrossRef] [PubMed] [Google Scholar]
- Peltier, W. 1974, Rev. Geophys., 12, 649 [NASA ADS] [CrossRef] [Google Scholar]
- Pierrehumbert, R. T. 2010, Principles of Planetary Climate (Cambridge: Cambridge University Press) [CrossRef] [Google Scholar]
- Porco, C. C., Helfenstein, P., Thomas, P. C., et al. 2006, Science, 311, 1393 [NASA ADS] [CrossRef] [PubMed] [Google Scholar]
- Roberts, J. H., & Nimmo, F. 2008, Icarus, 194, 675 [NASA ADS] [CrossRef] [Google Scholar]
- Segatz, M., Spohn, T., Ross, M. N., & Schubert, G. 1988, Icarus, 75, 187 [NASA ADS] [CrossRef] [Google Scholar]
- Solomatov, V., & Moresi, L.-N. 2000, J. Geophys. Res. Solid Earth, 105, 21795 [CrossRef] [Google Scholar]
- Spencer, J. R., Rathbun, J. A., Travis, L. D., et al. 2000, Science, 288, 1198 [NASA ADS] [CrossRef] [PubMed] [Google Scholar]
- Turbet, M., Bolmont, E., Leconte, J., et al. 2018, A&A, 612, A86 [CrossRef] [EDP Sciences] [Google Scholar]
- Unterborn, C. T., Desch, S. J., Hinkel, N. R., & Lorenzo, A. 2018, Nat. Astron., 2, 297 [NASA ADS] [CrossRef] [Google Scholar]
- Vance, S., Harnmeijer, J., Kimura, J., et al. 2007, Astrobiology, 7, 987 [NASA ADS] [CrossRef] [PubMed] [Google Scholar]
- Veeder, G. J., Matson, D. L., Johnson, T. V., Davies, A. G., & Blaney, D. L. 2004, Icarus, 169, 264 [NASA ADS] [CrossRef] [Google Scholar]
- Vida, K., Kővári, Z., Pál, A., Oláh, K., & Kriskovics, L. 2017, ApJ, 841, 124 [NASA ADS] [CrossRef] [Google Scholar]
- Vinson, A. M., & Hansen, B. M. S. 2017, MNRAS, 472, 3217 [NASA ADS] [CrossRef] [Google Scholar]
- Wang, S., Wu,D.-H., Barclay, T., & Laughlin, G. P. 2017, ApJ, submitted [arXiv:1704.04290] [Google Scholar]
- Wolf, E. T. 2017, ApJ, 839, L1 [Google Scholar]
- Wright, J. T. 2018, RNAAS, 2, 175 [NASA ADS] [Google Scholar]
All Tables
All Figures
|
Fig. 1 Most recent planetary masses and radii (Grimm et al. 2018; Delrez et al. 2018, black), compared to prior estimates from Wang et al. (2017, grey). Most of the planets could contain ice, rock, and metal: 75% ice by mass, with 12.5% rock and 12.5% iron (dashed line); pure rock (dotted); or 50% rock by mass, with 25% iron, and 25% ice (solid curve). |
| In the text | |
|
Fig. 2 Compositions and interior structures of planets TRAPPIST-1b through e. Panel A: representative possible interior structures of planets b through e, with layers of liquid water (dark blue), high-pressure ice polymorphs(light blue), rock (brown), and iron (black). Planets d and e are far enough from the TRAPPIST-1 star topotentially have a layer of solid ice (white) on their surfaces. Panels B–E: compositions of planets b through e, where the colour-coding indicates the volume fraction of H2 O permitted in each planet (ϕH2O = ϕiw + ϕhpp) as a functionof its volume fraction of iron (ϕFe) and rock (ϕr). Black stars indicate the cases shown in panel A. Planets b and d are substantially more H2 O-rich than planets c and e. |
| In the text | |
|
Fig. 3 Same as panels B–E of Fig. 2, but for TRAPPIST-1f, g, and h. The colour-coding indicates the volume fraction of H2O permitted in each planet (ϕH2O) as a functionof the volume fraction of iron (ϕFe) and rock (ϕr). |
| In the text | |
Current usage metrics show cumulative count of Article Views (full-text article views including HTML views, PDF and ePub downloads, according to the available data) and Abstracts Views on Vision4Press platform.
Data correspond to usage on the plateform after 2015. The current usage metrics is available 48-96 hours after online publication and is updated daily on week days.
Initial download of the metrics may take a while.