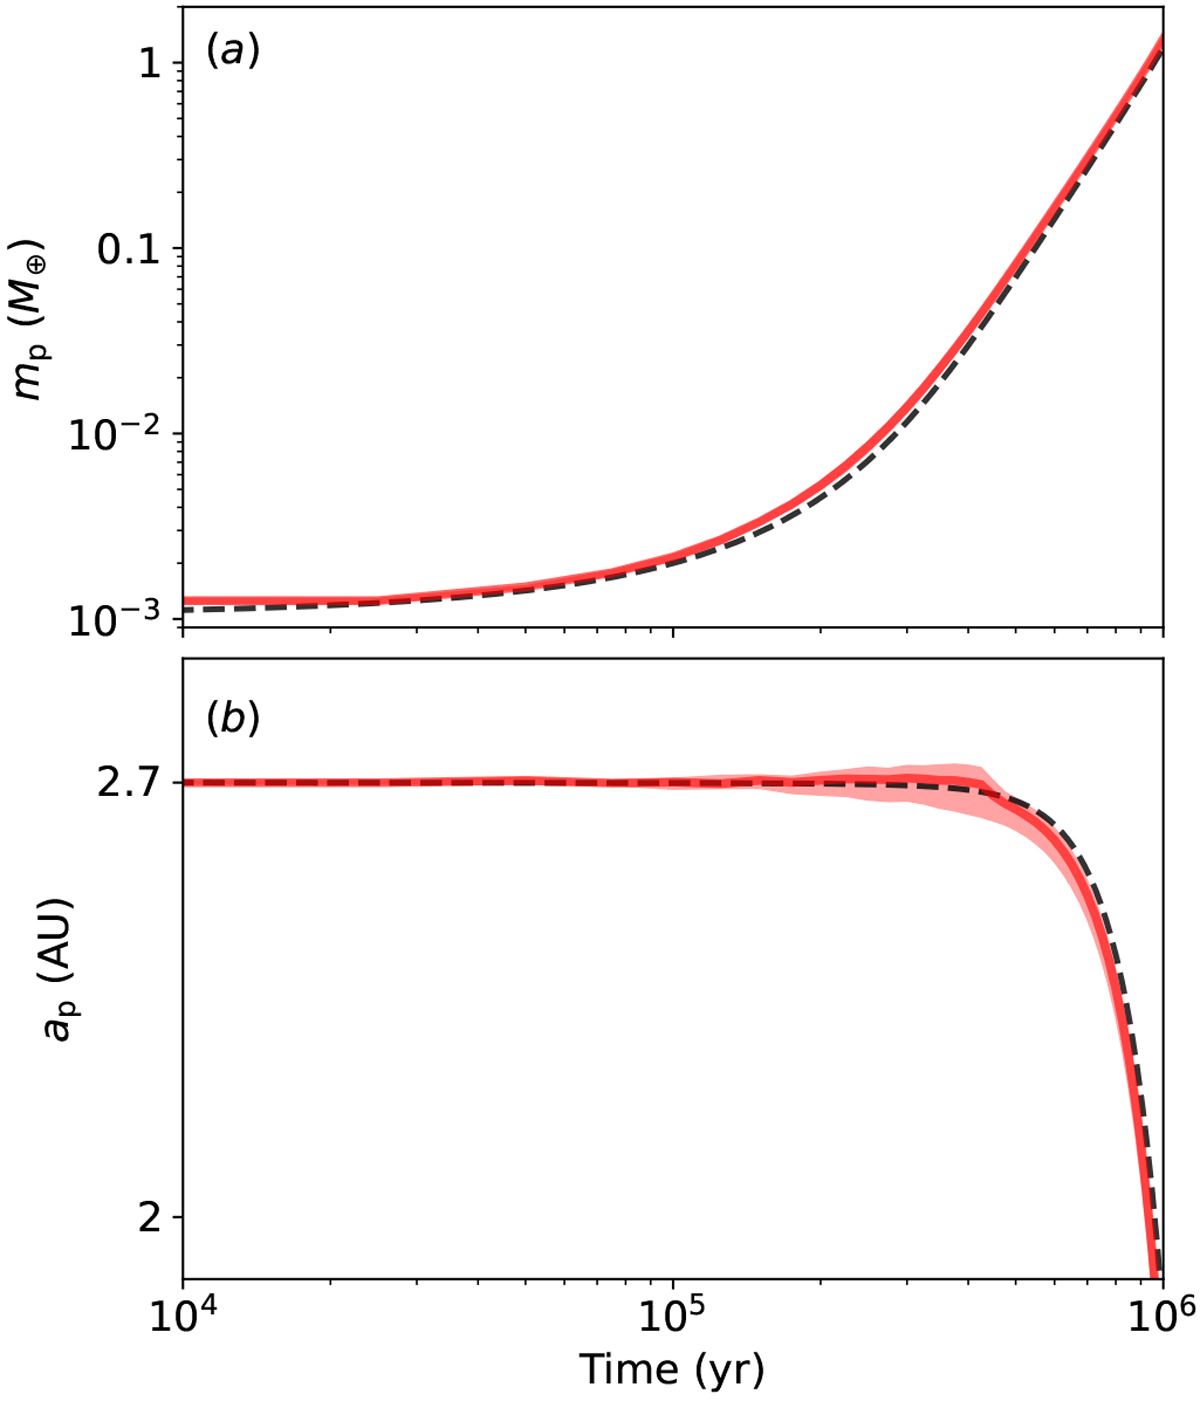
Fig. 7

Panel a: mass growth of the embryo for the two-component initial conditions in run_ sp. Panel b: semimajor axis evolution of the embryo. The red thick line is for the averaged value and the light red is for the spreading over three different runs. The black dashed line is for the growth of a single embryo on a circular and coplanar orbit without any planetesimal accretion.
Current usage metrics show cumulative count of Article Views (full-text article views including HTML views, PDF and ePub downloads, according to the available data) and Abstracts Views on Vision4Press platform.
Data correspond to usage on the plateform after 2015. The current usage metrics is available 48-96 hours after online publication and is updated daily on week days.
Initial download of the metrics may take a while.


