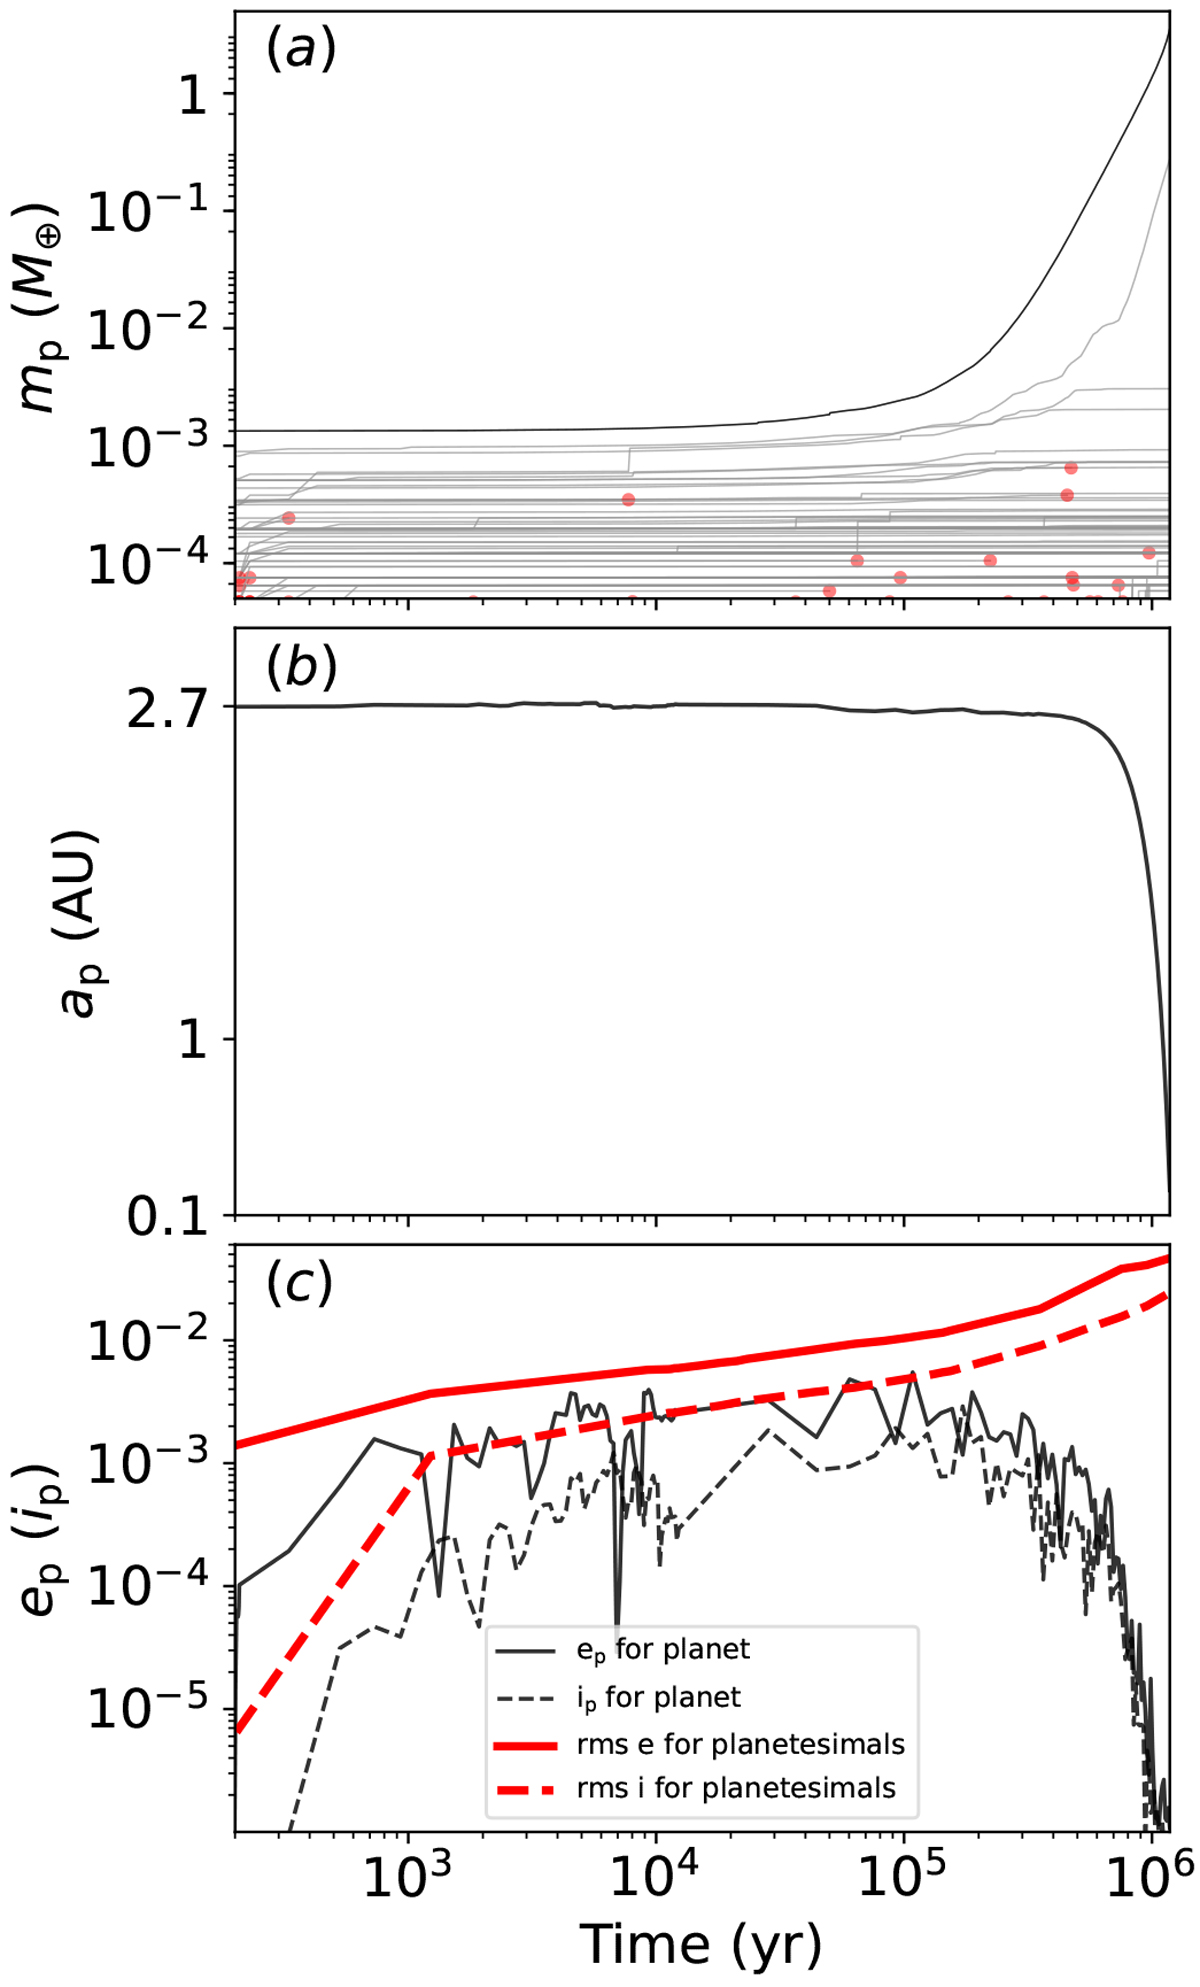
Fig. 6

Panel a: mass growth of the planetesimals for a poly-dispersed size population of planetesimals based on the blue branch of Fig. 5. The black line represent the growth of the final most massive body and gray lines are for other planetesimals. Red dots represents the merging of two bodies, marked at the position of the less massive body. The sudden growth is caused by planetesimal accretion and the smooth growth by pebble accretion. We note that fset approaches one when the planet is 0.01 M⊕. Panel b: semimajor axis evolution of the final most massive body. Panel c: eccentricity (solid) and inclination (dashed) evolution where black lines represent the final most massive body and the red lines indicate rms values of the planetesimals. The simulation is from run_ pd_1.
Current usage metrics show cumulative count of Article Views (full-text article views including HTML views, PDF and ePub downloads, according to the available data) and Abstracts Views on Vision4Press platform.
Data correspond to usage on the plateform after 2015. The current usage metrics is available 48-96 hours after online publication and is updated daily on week days.
Initial download of the metrics may take a while.


