Fig. 9
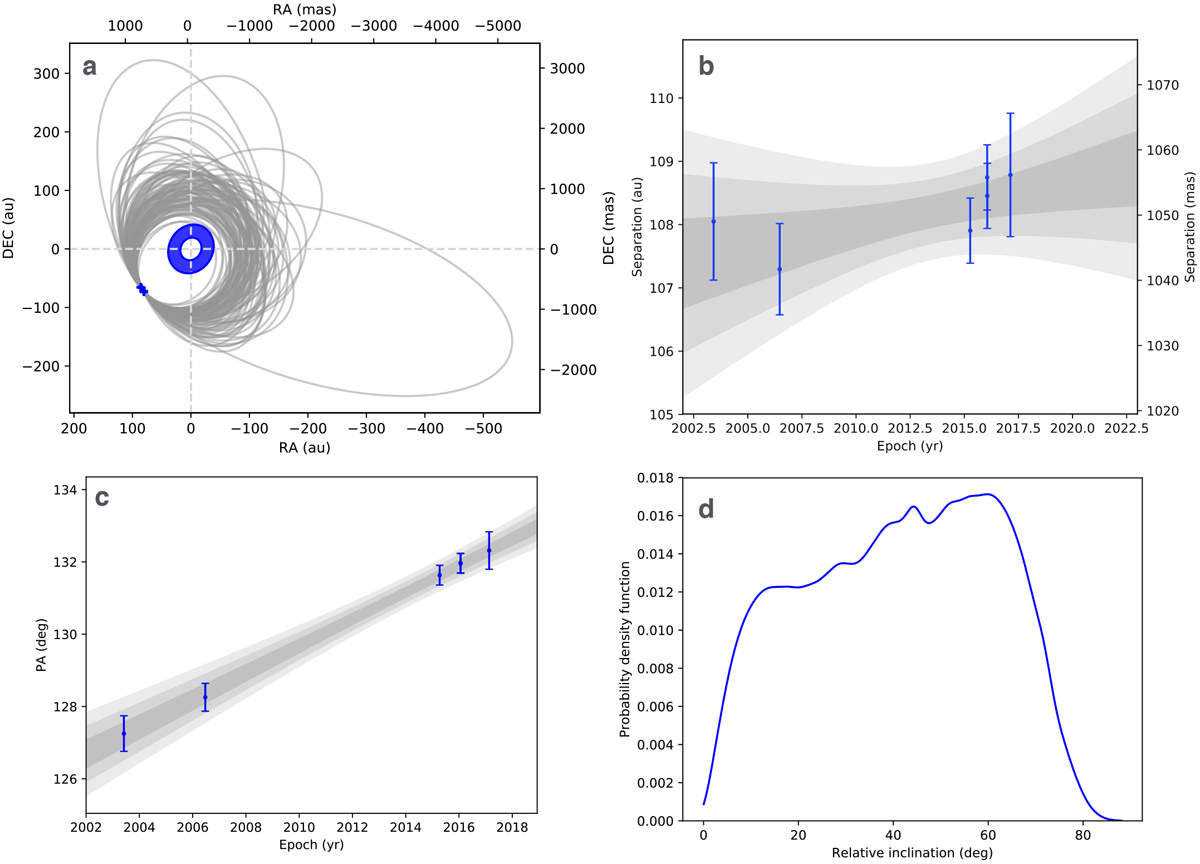
Summary of the orbital fitting results. Panel a: plots of a hundred trajectories obtained with the MCMC algorithm for the orbit of HD 100453 B. A cartoon of the dust disk is shown at the center. Panel b: evolution of separation with respect to time. The three shades of gray represent the 1, 2 and 3 σ intervals. Panel c: similar to the 2nd panel, but for the evolution of position angle with respect to time. Panel d: posterior distribution of the relative inclination between the HD 100453 B orbit and the disk plane.
Current usage metrics show cumulative count of Article Views (full-text article views including HTML views, PDF and ePub downloads, according to the available data) and Abstracts Views on Vision4Press platform.
Data correspond to usage on the plateform after 2015. The current usage metrics is available 48-96 hours after online publication and is updated daily on week days.
Initial download of the metrics may take a while.