Fig. 7
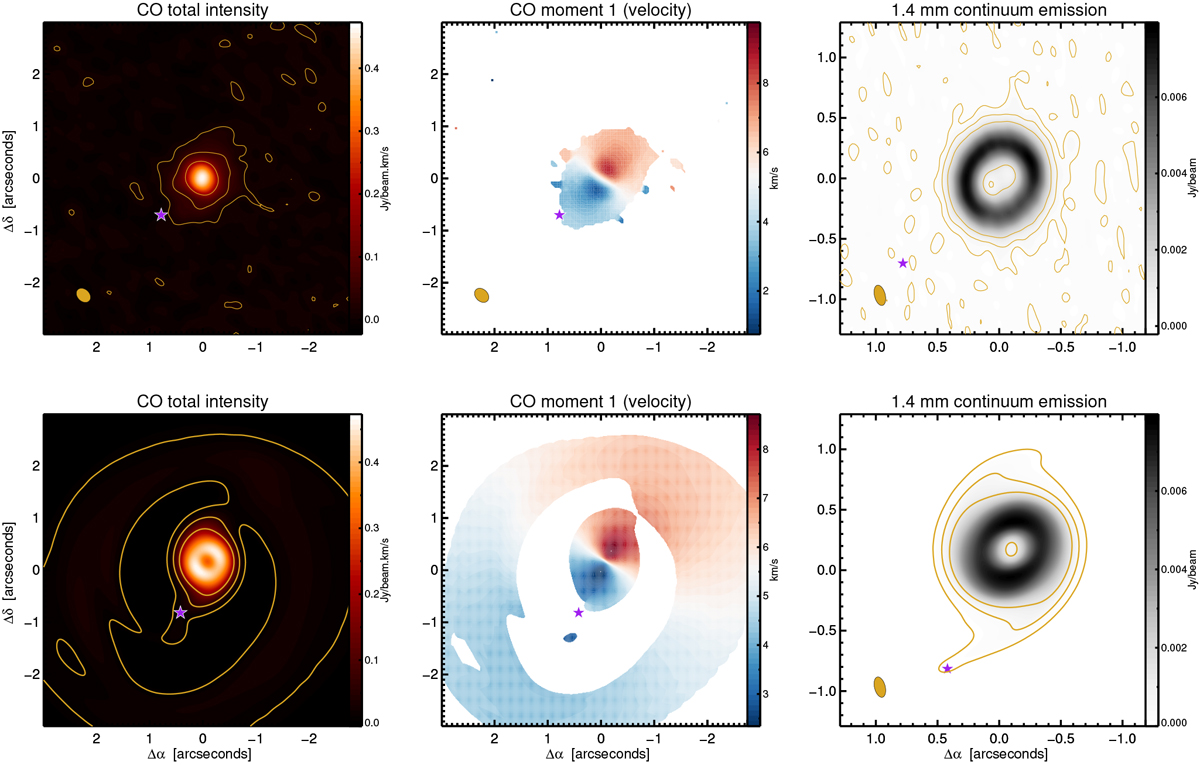
Comparison between the ALMA observations (top row) and the ray-traced SPH simulations (bottom row). Panels from left toright: CO integrated intensity (moment 0) map, CO intensity weighted velocity field (moment 1) map, and the 1.4 mm dust emission map. The purple star represents the location of HD 100453 B in all panels. For the CO moment 1 map (middle panel) we only include emission that is within a certain fraction of the peak emission in the image channels. The maximum observed dynamic range in our observations is 40, and we construct the model moment 1 maps using only emission that is brighter than a fraction of 3/40 of the peak intensity. Top left and right panels: 2, 10 and 30 σ contours using yellow lines. For the bottom panels we use the dynamic range from the observations to approximate these contours as fraction of the maximum emission in the simulated maps.
Current usage metrics show cumulative count of Article Views (full-text article views including HTML views, PDF and ePub downloads, according to the available data) and Abstracts Views on Vision4Press platform.
Data correspond to usage on the plateform after 2015. The current usage metrics is available 48-96 hours after online publication and is updated daily on week days.
Initial download of the metrics may take a while.