Fig. 6
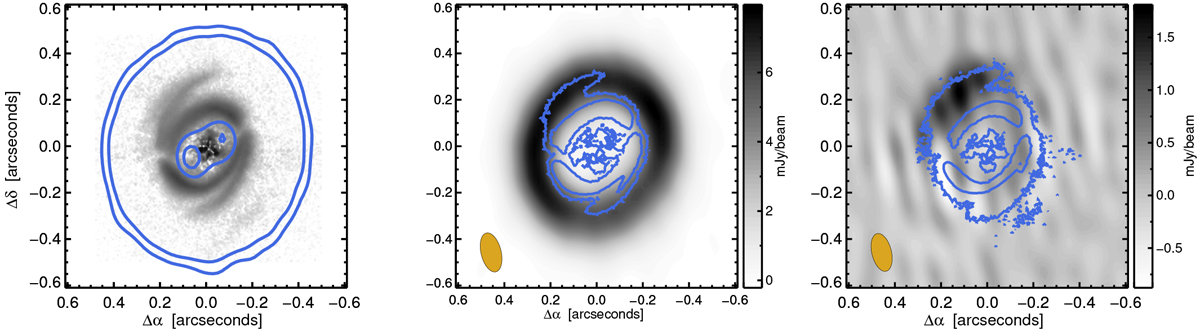
Left panel: J-band Qϕ image reproduced from Benisty et al. (2017) in arbitrary intensity units with an overlay of the 12 and 25 σ contours of the ALMA data presented in Fig. 1. Central panel: inverted counterpart to the images shown in the left panel but with arbitrary contours of the SPHERE data overlayed on the ALMA data. Right panel: ALMA residuals after subtracting the best-fit disk, ring and central point source components summarized in Table 2 in visibility space, imaged using superuniform weighting. The same contours as shown for the SPHERE images in the central panel are again overlayed. The Gaussian component of the ALMA continuum emission appears to coincide well with the northern spiral arm seen in scattered light.
Current usage metrics show cumulative count of Article Views (full-text article views including HTML views, PDF and ePub downloads, according to the available data) and Abstracts Views on Vision4Press platform.
Data correspond to usage on the plateform after 2015. The current usage metrics is available 48-96 hours after online publication and is updated daily on week days.
Initial download of the metrics may take a while.