Fig. 5
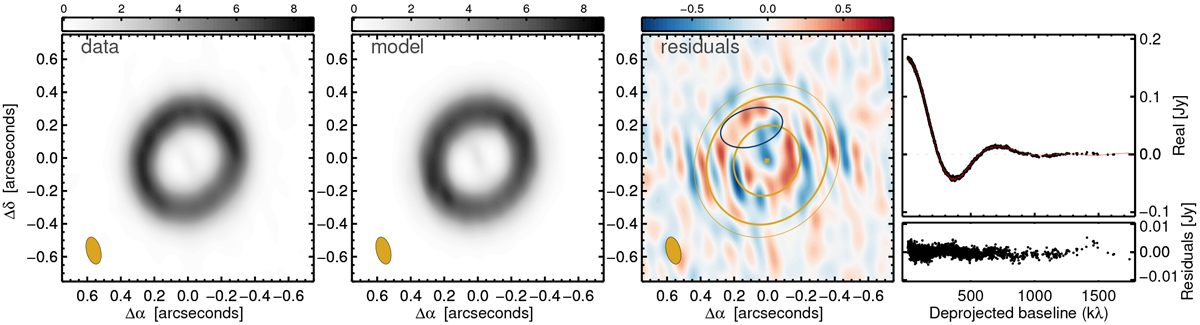
Comparison of ALMA band 6 data (left panel) with the best-fit composite model (second panel). Third panel: imaged residual visibilities. This panel also includes ellipses representing the fitted disk and the central components in yellow thick lines, the outer ring with a yellow thin line, andthe Gaussian component with a dark solid line. Units of all intensity scales are in mJy beam−1. Top right panel: real part of the visibilities as function of the deprojected baseline for the data (black dots) and model (red line). Bottom panel: residuals. The visibilities are binned in sets of 200.
Current usage metrics show cumulative count of Article Views (full-text article views including HTML views, PDF and ePub downloads, according to the available data) and Abstracts Views on Vision4Press platform.
Data correspond to usage on the plateform after 2015. The current usage metrics is available 48-96 hours after online publication and is updated daily on week days.
Initial download of the metrics may take a while.