Fig. 2
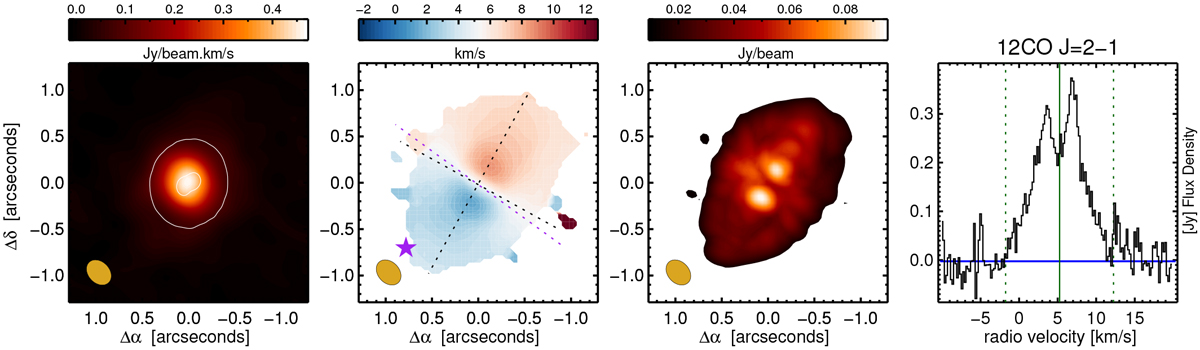
Summary of the 12CO line emission in HD 100453. We show the integrated intensity (moment 0, left panel), intensity-weighted velocity (moment 1, 2nd panel), peak intensity (moment 8, 3rd panel) and the integrated emission line (right panel). The moment 1 + 8 maps were made using a 3 σ cutoff from images reconstructed using natural weighting to maximize sensitivity. Over plotted in the 1st panel is the 25 σ (1.27 mJy beam−1) contour of the continuum emission shown in Fig. 1. The beam is shown in orange in the bottom left of each panel. We show the approximate position of HD 100453 B during our observations (1′′.05 at PA = 132° Wagner et al. 2018) with a purple star in the 2nd panel, together with two dotted lines that show the major and minor disk axis of a disk with a semi major axis value listed in Table 3 and the inclination and position angle determined from fitting the continuum emission. The purple line highlights the clockwise rotation of the velocity field discussed in Sect. 4.2. The line profile shown in the right panel shows the integration boundaries used to calculate the total line emission (a half line width of 7.0 km s−1), the systemic velocity of 5.25 km s−1, and the level of the continuum emission used to calculate the integrated line flux.
Current usage metrics show cumulative count of Article Views (full-text article views including HTML views, PDF and ePub downloads, according to the available data) and Abstracts Views on Vision4Press platform.
Data correspond to usage on the plateform after 2015. The current usage metrics is available 48-96 hours after online publication and is updated daily on week days.
Initial download of the metrics may take a while.