Fig. 7.
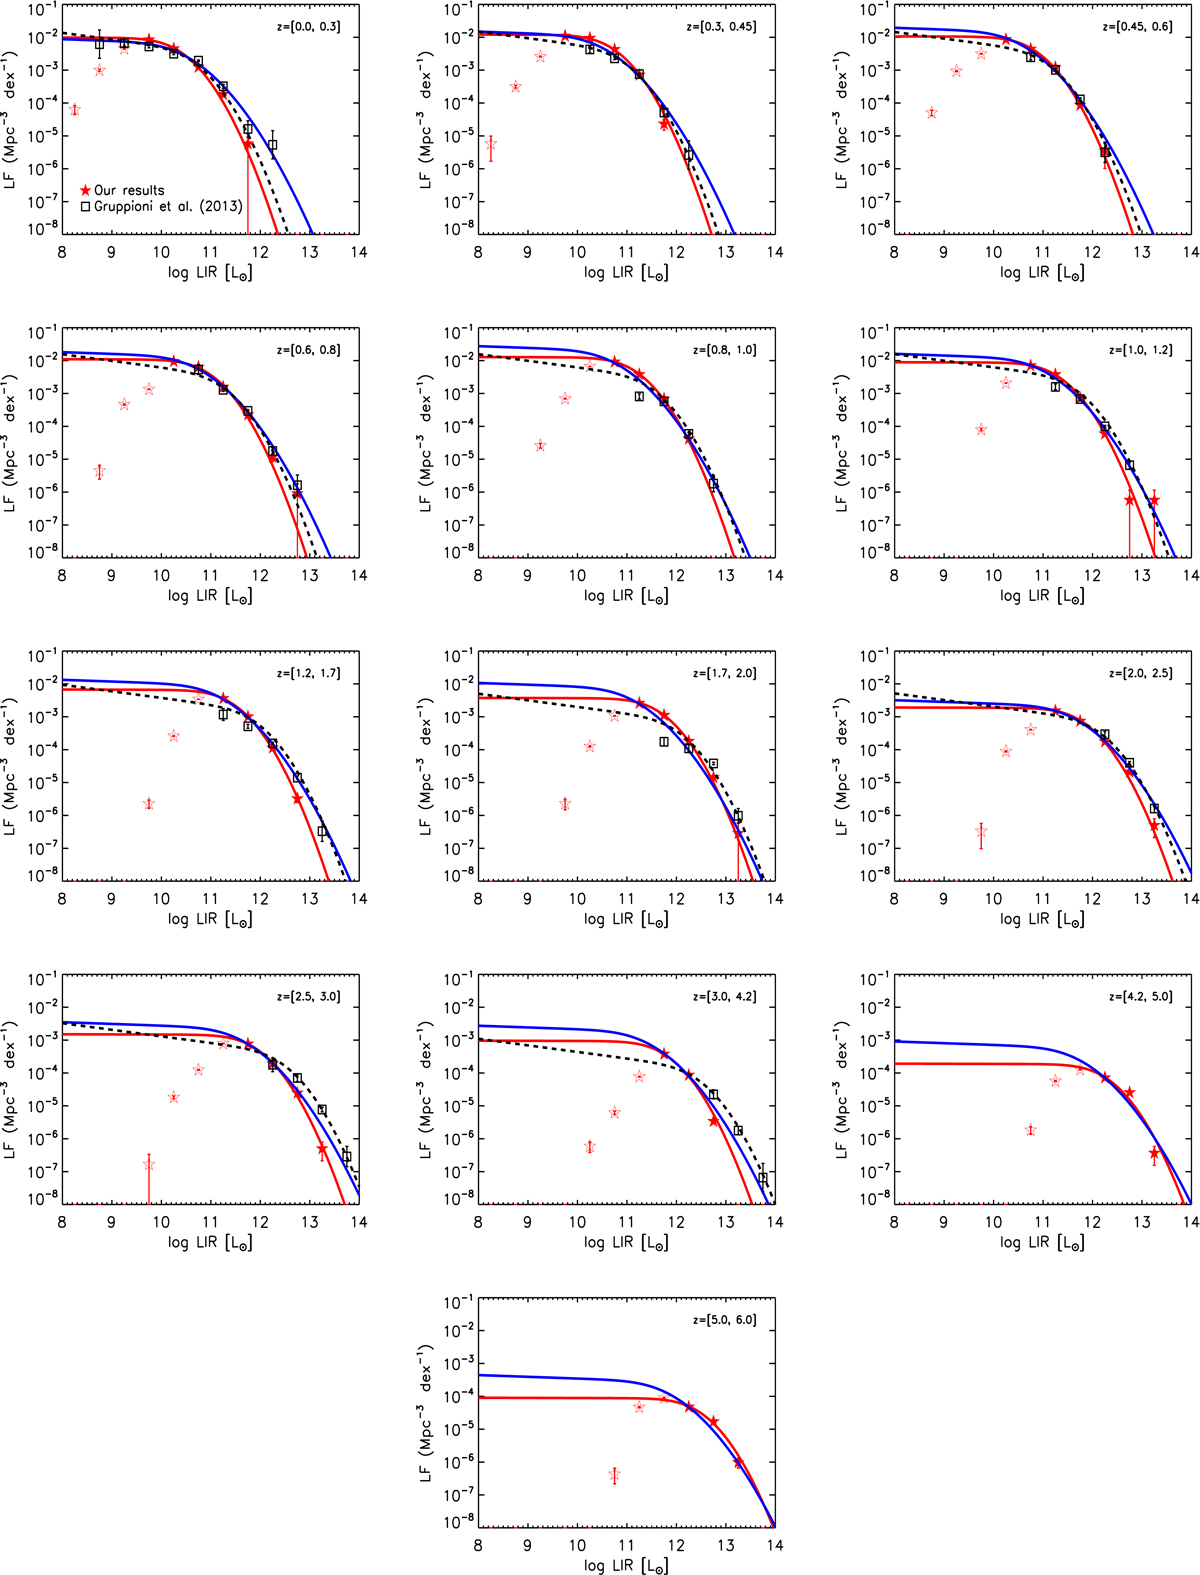
Total IR LF out to z ∼ 6. The red stars are derived from our de-blended catalogue in COSMOS (filled red stars: our LF above the completeness limit; empty red stars: our LF below the completeness limit). Error bars on the red stars only represent Poisson errors. The black squares are from Gruppioni et al. (2013). The dashed line is the best-fit modified-Schechter function from Gruppioni et al. (2013). The red line is the best-fit function derived from fitting to our measurements of the IR LF only (i.e., the filled red stars). The blue line is the best-fit function derived from fitting to both our IR LFs and the measurement in Gruppioni et al. (2013) (i.e. the filled red stars and the black squares).
Current usage metrics show cumulative count of Article Views (full-text article views including HTML views, PDF and ePub downloads, according to the available data) and Abstracts Views on Vision4Press platform.
Data correspond to usage on the plateform after 2015. The current usage metrics is available 48-96 hours after online publication and is updated daily on week days.
Initial download of the metrics may take a while.