Fig. 5.
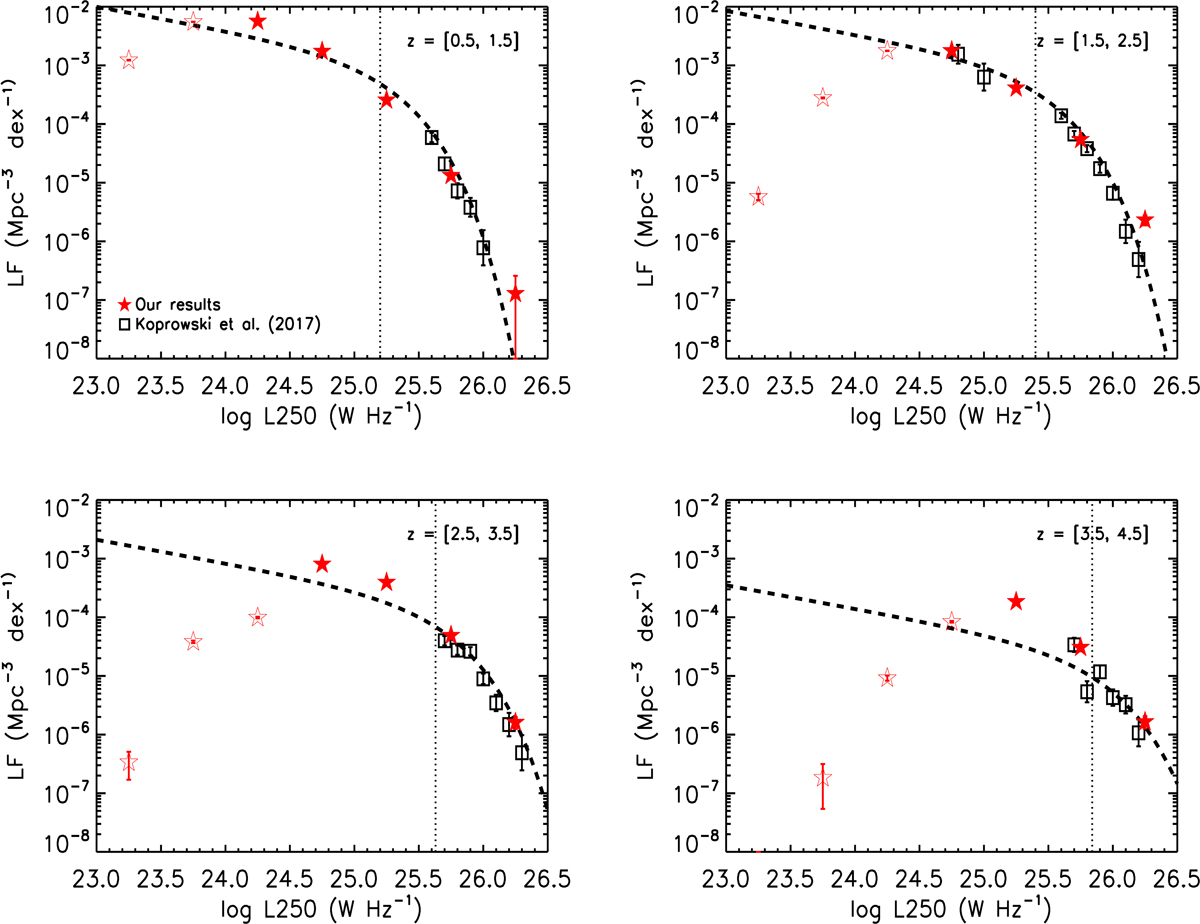
Rest-frame 250 μm LF. The red stars are derived from our de-blended catalogue in COSMOS (filled red stars: our LF above the completeness limit; empty red stars: our LF below the completeness limit). Error bars on the red stars only represent Poisson errors. The black empty squares are taken from Koprowski et al. (2017), based on SCUBA-2 850 μm observations of the COSMOS and UKIDSS-UDS fields as part of the S2CLS. The two faintest points in the Koprowski et al. (2017) measurements in the 1.5 < z < 2.5 redshift bin (which has the largest dynamic range) were derived using the ALMA 1.3 mm data. The dashed line is the best-fit Schechter function adopted in Koprowski et al. (2017). The faint-end slope of the Schechter function was found to be α = −0.4 in the 1.5 < z < 2.5 redshift bin in Koprowski et al. (2017) and was kept fixed in the remaining three redshift bins. The vertical dotted line indicates the location of the characteristic luminosity, i.e. L* in Eq. (1), as derived in Koprowski et al. (2017).
Current usage metrics show cumulative count of Article Views (full-text article views including HTML views, PDF and ePub downloads, according to the available data) and Abstracts Views on Vision4Press platform.
Data correspond to usage on the plateform after 2015. The current usage metrics is available 48-96 hours after online publication and is updated daily on week days.
Initial download of the metrics may take a while.