Fig. 4.
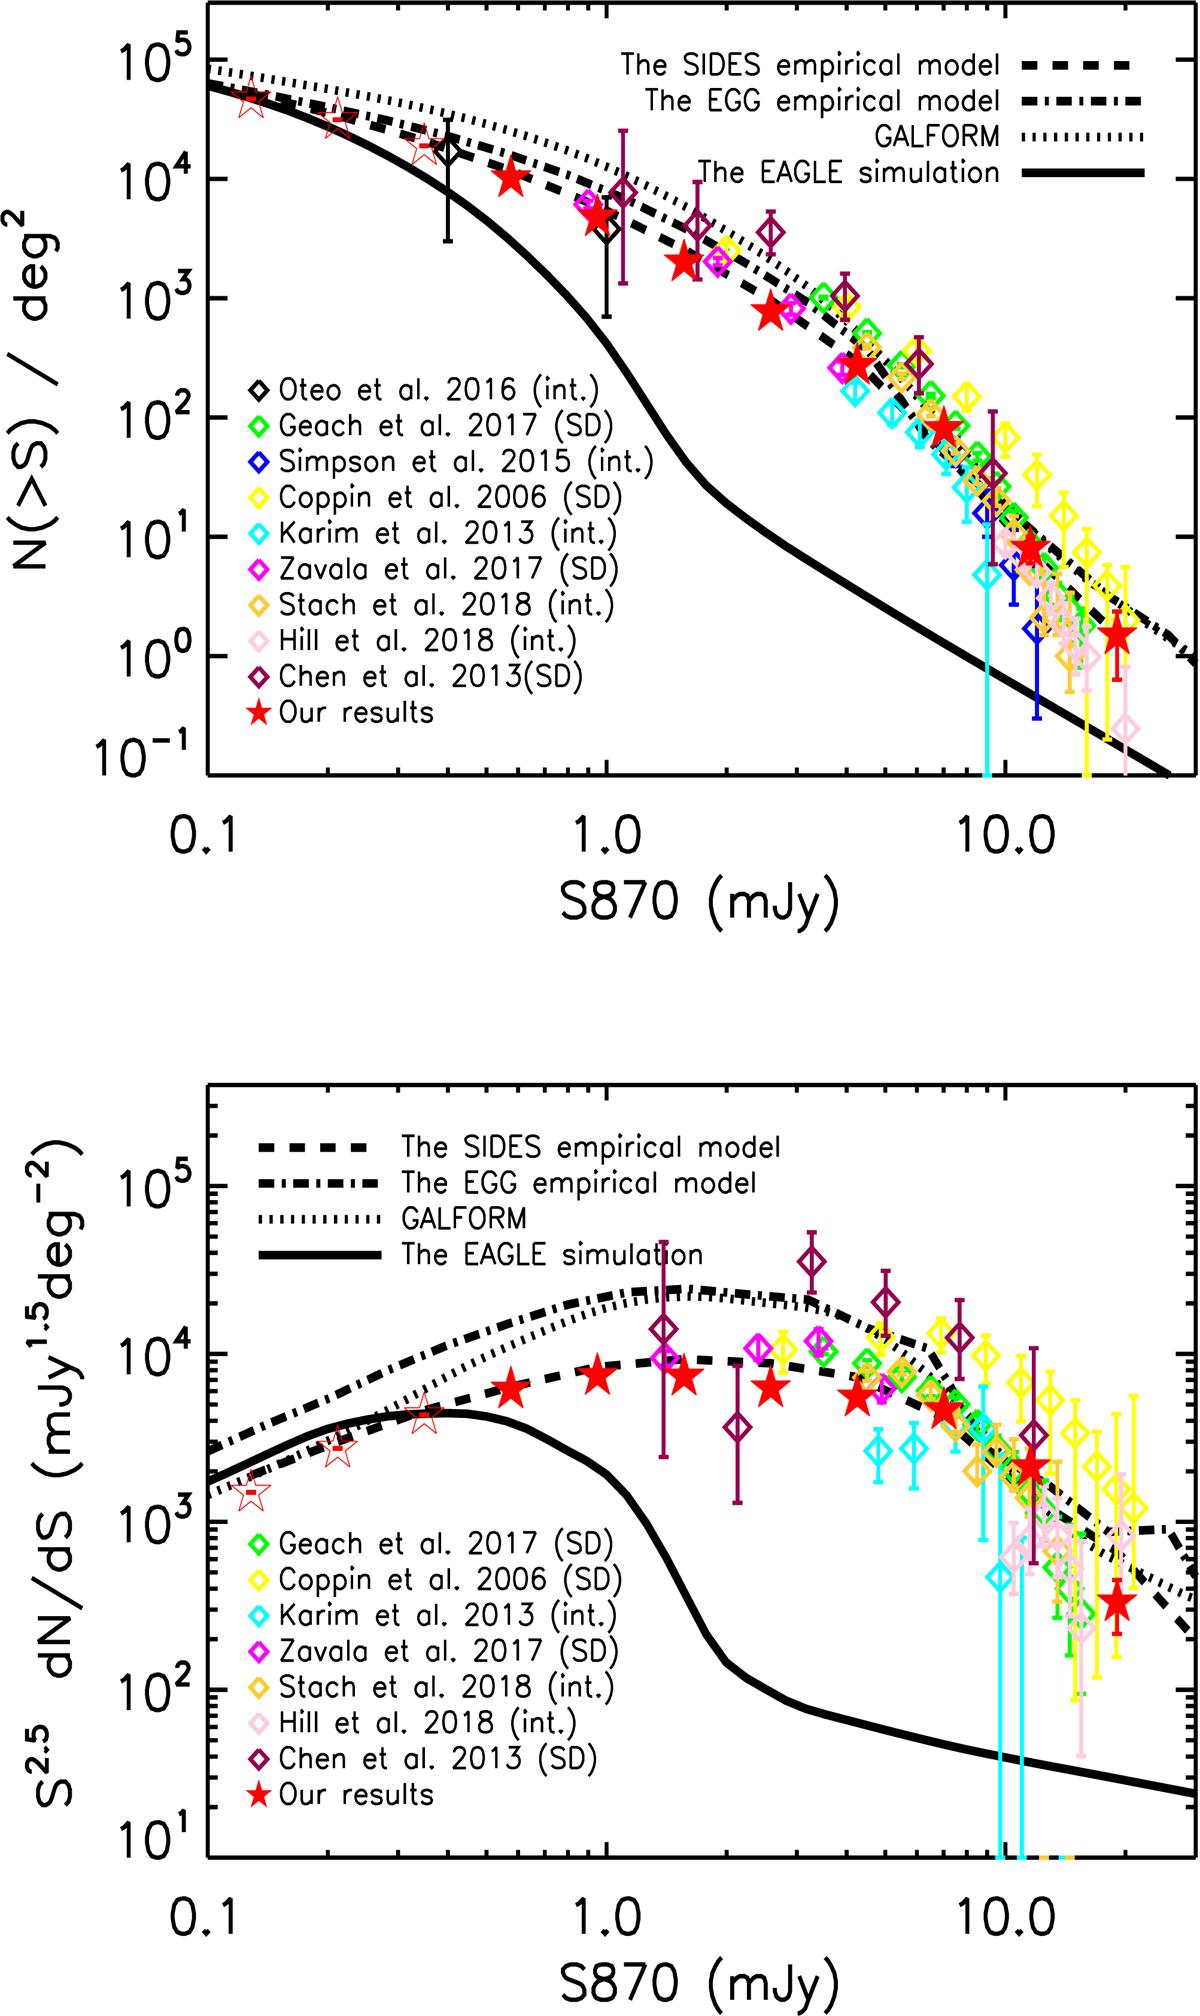
Upper panel: cumulative number counts at 870 μm. Our results derived from the de-blended catalogue in COSMOS are plotted as red stars (filled red stars: our number counts above the flux cut; empty red stars: our number counts below the flux cut). Error bars on the red stars only represent Poisson errors. The lines show the predicted number counts from various models and simulations (including SIDES, EGG, GALFORM, and the EAGLE hydrodynamic simulation). The empty diamonds are previous results using either single-dish (SD) observations or interferometric (int.) observations. The SCUBA-2 number counts are shown as a function of 850 μm flux density and the SMA number counts are plotted as a function of 860 μm flux density, but we ignored the slightly different effective wavelengths of the different instruments. Lower panel: differential number counts at 870 μm.
Current usage metrics show cumulative count of Article Views (full-text article views including HTML views, PDF and ePub downloads, according to the available data) and Abstracts Views on Vision4Press platform.
Data correspond to usage on the plateform after 2015. The current usage metrics is available 48-96 hours after online publication and is updated daily on week days.
Initial download of the metrics may take a while.