Free Access
Fig. 1.
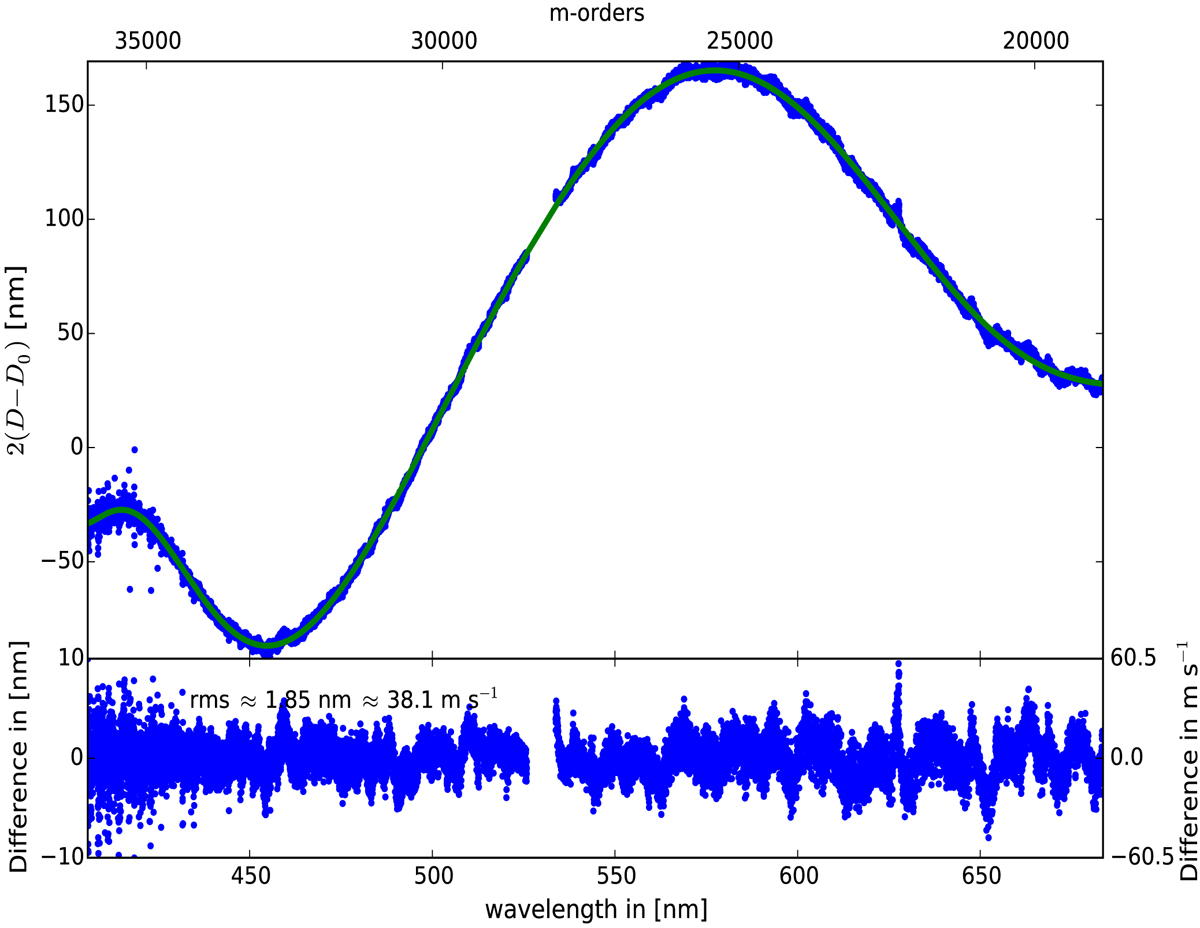
Effective etalon gap variation 2D(λ)−2D0 as a function of wavelength as computed for each Fabry-Pérot peak using the initial thorium wavelength solution (blue line, upper panel). The green line shows the best-fit polynomial. The residuals to the fit are shown in the lower panel.
Current usage metrics show cumulative count of Article Views (full-text article views including HTML views, PDF and ePub downloads, according to the available data) and Abstracts Views on Vision4Press platform.
Data correspond to usage on the plateform after 2015. The current usage metrics is available 48-96 hours after online publication and is updated daily on week days.
Initial download of the metrics may take a while.