| Issue |
A&A
Volume 664, August 2022
|
|
|---|---|---|
| Article Number | A191 | |
| Number of page(s) | 8 | |
| Section | Astronomical instrumentation | |
| DOI | https://doi.org/10.1051/0004-6361/202243270 | |
| Published online | 31 August 2022 | |
Chromatic drift of the Espresso Fabry-Pérot etalon
1
Observatoire Astronomique de l’Université de Genève,
Chemin Pegasi 51,
Sauverny
1290,
Switzerland
e-mail: This email address is being protected from spambots. You need JavaScript enabled to view it.
2
European Southern Observatory,
Alonso de Córdova
3107,
Vitacura, Región Metropolitana, Chile
3
Instituto de Astrofísica e Ciências do Espaço, Universidade do Porto,
CAUP, Rua das Estrelas,
4150-762
Porto, Portugal
Received:
4
February
2022
Accepted:
12
April
2022
Abstract
In the last decade, white-light illuminated Fabry-Pérot interferometers have been established as a widely used, relatively simple, reliable, and cost-effective way to precisely calibrate high-resolution echelle spectrographs. However, a recent study reported a chromatic drift of the Fabry-Pérot interferometer installed at the Habitable-zone Planet Finder spectrograph. In particular, they found that the variation of the etalon effective gap size is not achromatic, as has usually been assumed, but that, in fact, it depends on wavelength. Here, we present a similar study of the Espresso Fabry-Pérot interferometer. Using daily calibrations spanning a period of over 2.5 yr, we also find clear evidence for a chromatic drift with an amplitude of a few cm s−1 per day with a characteristic, quasi-oscillatory dependence on wavelength. We conclude that this effect is probably caused by the aging of the dielectric mirror coatings and we expect that similar chromatic drifts might affect all Fabry-Pérot interferometers used for the calibration of astronomical spectrographs. However, we also demonstrate that the chromatic drift can be measured and, in principle, corrected using only standard calibrations based on hollow cathode lamp spectra.
Key words: instrumentation: spectrographs / techniques: spectroscopic / techniques: radial velocities
© T. M. Schmidt et al. 2022
 Open Access article, published by EDP Sciences, under the terms of the Creative Commons Attribution License (https://creativecommons.org/licenses/by/4.0), which permits unrestricted use, distribution, and reproduction in any medium, provided the original work is properly cited.
This article is published in open access under the Subscribe-to-Open model. This email address is being protected from spambots. You need JavaScript enabled to view it. to support open access publication.
1 Introduction
High-resolution echelle spectrographs are workhorses for astronomical research, however, many scientific application crucially rely on highly precise and accurate wavelength calibrations. Most famous in this context is the search for extrasolar planets using the radial-velocity method (e.g., Mayor & Queloz 1995) but also studies in the field of cosmology and fundamental physics (e.g., Sandage et al. 1965; Webb et al. 1999; Murphy et al. 2022) pose very demanding requirements on the spectrograph’s wavelength calibration. This necessarily requires dedicated and specialized wavelength calibration sources.
In the last decade, white-light illuminated Fabry-Pérot etalons (FP, Perot & Fabry 1899) have been established as relatively simple and cost-effective but, nonetheless, highly precise means of wavelength calibration for echelle spectrographs and are now widely used at many observatories (see e.g., Wildi et al. 2010, 2011, 2012; Bauer et al. 2015; Stürmer et al. 2017; Seifahrt et al. 2018; Hobson et al. 2021). They produce over a very broad spectral range a dense train of similarly bright lines which are (almost) equally spaced in frequency space, similarly to a comb, and serve, therefore, as excellent wavelength calibration sources for high-resolution spectrographs.
While the width of the individual lines is defined by the reflectivity of the etalon surfaces, the spectral separation of the lines is given by the size of the gap in between the two etalon mirrors. Thus, both parameters, namely: the line width and line separation, can be rather easily engineered to suit the needs of a given spectrograph. More specifically, for a Fabry-Pérot interferometer with a physical separation, D, of the etalon surfaces, the wavelength of a specific line with index, k, is given by:
 (1)
(1)
where n describes the index of refraction of the medium that fills the space between the two mirrors.
As follows, the transmission spectrum of a Fabry-Pérot etalon is subject to changes in the environmental conditions, namely: the temperature and pressure, which can have an influence on the physical spacing of the mirrors and the index of refraction. To limit these effects, etalons are usually placed inside a temperature- and pressure-controlled vacuum vessel and are built from materials that exhibit very limited thermal expansion. Still, the spectrum of such a passively stabilized Fabry-Pérot interferometer is, in principle, “freely floating”, in the sense that it is not anchored to a wavelength reference and will (slowly) drift over time. Therefore, a Fabry-Pérot interferometer does not provide any absolute wavelength information but always has to be used in conjunction with a second calibration source that does provide absolute wavelength information. In most cases, this source is a thorium-argon or uranium-neon hollow cathode lamp. While these sparse, unevenly distributed, and unequally bright atomic transitions of a hollow cathode lamp are of themselves completely insufficient to define a precise and accurate wavelength solution for a high-resolution echelle spectrograph1, they provide enough information to accurately characterize the gap size of a Fabry-Pérot interferometer which then acts as a rather sophisticated method to precisely interpolate between the atomic lines. The joint information from a Fabry-Pérot interferometer and a hollow cathode lamp can therefore be utilized to establish a high-fidelity wavelength solution and to precisely track the drift of stabilized spectrographs (Bauer et al. 2015; Cersullo et al. 2019).
Unfortunately, the FP gap size is, in contrast to the simple form given in Eq. (1), not a constant but depends on wavelength. This is usually attributed to the use of dielectric coatings on the etalon mirrors that (simply speaking) causes the light of different wavelengths to be reflected at different depths (Wildi et al. 2010; Bauer et al. 2015). Therefore, Eq. (1) has to be modified by introducing a wavelength-dependent “effective gap size”, Deff(λ), instead of just D, which describes the length of the Fabry-Pérot cavity as function of wavelength. Nevertheless, Deff (λ) is, in practice, a smooth and slowly varying function that can be accurately determined by comparing Fabry-Pérot spectra to spectra of hollow cathode lamps, as described, for instance, in Cersullo et al. (2019) or Schmidt et al. (2021).
In addition, it is often assumed that the wavelength dependence of the Fabry-Pérot gap size is independent from its time evolution, namely, that there is some function Deff(λ) that describes the spectral properties and is likely related to the structure of the dielectric coating but that is, by itself, static and has in principle to be measured only once, and in addition to that, a drift D(t), which has to be measured regularly (e.g., before and after each night) but affects all wavelengths in the same way by just increasing or decreasing the gap size by a constant value. The latter effect could be attributed to an expansion or shrinkage of the spacer separating the etalon mirrors, for instance, due to thermal variations, or a change of the residual pressure in the vacuum vessel. This concept has even lead to the development of actively stabilized Fabry-Pérot interferometers (see e.g., Stürmer et al. 2017), in which the cavity is at a single frequency locked against a stabilized laser – in the hope that this scheme eliminates the drift at all wavelengths.
Recently, however, Terrien et al. (2021) presented a detailed analysis of the Fabry-Pérot interferometer of the near-IR Habitable-zone Planet Finder spectrograph (HPF, Mahadevan et al. 2014) installed at the Hobby-Eberly Telescope at the McDonald Observatory in Texas. By comparing the spectrum of the Fabry-Pérot interferometer to the fully independent and highly accurate wavelength solution derived from the laser frequency comb system at HPF (Metcalf et al. 2019a,b), they were able to characterize the Fabry-Pérot interferometer in detail and precisely track its drifts over a period of six months. Unsurprisingly, Terrien et al. (2021) found a global bulk velocity shift of ≈ −2 cm s−1 day−1. However, the measured drift depends quite strongly on wavelength, varying between −7 and +4 cm s−1day−1, and shows a semi-periodic behavior as function of wavelength. This “chromatic drift” of the Fabry-Pérot interferometer, which actually dominates over the bulk velocity drift, was not expected and seen by Terrien et al. (2021) for the first time with an astronomical spectrograph.
Here, we present a very similar study of the Fabry-Pérot etalon of the Echelle SPectrograph for Rocky Exoplanets and Stable Spectroscopic Observations (Espresso, Molaro 2009; Pepe et al. 2010, 2014, 2021) installed at the incoherently combined Coundé focus of the ESO Very Large Telescope. Espresso has been in regular operation since November 2018. We therefore have daily calibration data available for a total period of 2.5 yr, but with a gap of about eight months in Summer 2020, when the observatory was closed. This extensive dataset allows us to explore if the Espresso Fabry-Pérot interferometer shows a similar chromatic drift as seen with the HPF spectrograph and to determine whether the findings reported by Terrien et al. (2021) are a peculiar effect of the HPF system or represent a general effect that is, despite rather different designs, present in all astronomical Fabry-Pérot interferometers.
2 Data
For this study, we used all the calibrations in singleHR mode with a binning of 1 × 1 (see Pepe et al. 2021, for details) taken between 1 November 2018 and 31 May 2021. In this mode, Espresso offers a spectral resolution of  and it is in 1 × 1 binning used for the majority of bright radialvelocity targets. In addition, the calibration spectra taken in this mode have a signal-to-noise ratio (S/N) that is about
  higher than for 2 × 1 binning and provide the largest dataset, since calibrations for the ultra-high resolution mode, which would offer lower S/N but substantially higher resolution, are not taken on a daily basis. The instrument calibration plan foresees calibrations to be taken every morning, composed of bias frames, spectral flatfield exposures, as well as Fabry-Pérot and thorium-argon spectra. Additional Fabry-Pérot and thorium-argon exposures are taken in the late afternoons or evenings. Therefore, we usually have two full calibrations available per day. The total dataset used in this study contains 1658 epochs and spans 941 days, however, there are no calibrations available between 2020-03-21 and 2020-11-29 due to a complete closure of the Paranal observatory and a shutdown of all operations.
The Espresso Fabry-Pérot device is based on the long legacy of very similar devices built at the Geneva Observatory and follows the same design as described in Wildi et al. (2010, 2011, 2012). It covers the full wavelength range of Espresso from 3800 Å to 7900 Å and is designed with a mirror spacing of approximately 7.1mm, corresponding to a separation between modes of slightly less than 20 GHz. The nominal finesse is relatively low, approximately  , and the Fabry-Pérot lines are noticeably resolved by the spectrograph. The Fabry-Pérot device is kept in a vacuum vessel which is continuously pumped to keep the residual pressure at a level of approximately 10−5 mBar and actively stabilized to a temperature slightly above ambient.
In principle, Espresso is equipped with a Laser Frequency Comb (LFC, Mégevand et al. 2014; Probst et al. 2014, 2016; Schmidt et al. 2021) that provides a highly precise and accurate wavelength solution and would be the ideal reference to characterize the Fabry-Pérot interferometer. However, the Espresso LFC still suffers from substantial reliability issues. For the given time period, LFC exposures are available in the ESO archive for only 124 days, distributed over the months of November 2018 and July to November 2019. In addition, the LFC offers only a limited wavelength coverage, corresponding to approximately 57% of the total Espresso spectral range. Therefore, we decided to rely for this study exclusively on the spectra of the thorium-argon (ThAr) hollow cathode lamp as absolute wavelength reference to characterize the Fabry-Pérot interferometer. Clearly, the thorium-argon spectra have disadvantages, namely, the much lower number, unequal spacing, and generally lower S/N of the lines. Also, there is some uncertainty to which degree the spectral lines are stable over long timescales or possibly affected by the aging of the lamp (see e.g., Nave et al. 2018). However, the much larger coverage in terms of spectral range and time provided by the thorium-argon spectra is essential for the purpose of this study and clearly outweighs the disadvantages. In the following, we show that despite their imperfections, the thorium-argon spectra are sufficient to facilitate a detailed characterization of the Fabry-Pérot interferometer and to draw solid conclusions about the presence of a chromatic drift.
All data in the study were reduced with the Espresso Data Reduction System (DRS, version 2.3.12, Lovis et al., in prep.) in the standard way as it is used for the Data & Analysis Center for Exoplanets (DACE3) hosted at the Geneva Observatory. We used the default ThAr line list incorporated in the Espresso DRS (Lovis et al. in prep.). This contains a relatively sparse selection of 407 unique thorium lines which were carefully selected to be unblended and of high quality. For various reasons, these lines appear multiple times in a single exposure, for instance, because Espresso uses a pupil slicer which images each spectral order into two independent traces, but also due to substantial overlap of the individual echelle orders. In addition, we used calibration data from both optical fibers, since they provide equal and consistent information. Following this, we have for each epoch 2300 thorium line measurements available.
By comparing Fabry-Pérot to thorium-argon spectra taken immediately one after another, we can derive, from each individual thorium line position a measurement of the Fabry-Pérot effective gap Deff(t, λ) at the given time t and wavelength λ. The concept behind this is explained in detail in Schmidt et al. (2021). Briefly, the measured position of a thorium line is compared to the Fabry-Pérot lines falling in the same region and the known absolute wavelength of the spectral line can be used, after assigning the correct indices to the Fabry-Pérot lines, to deduce the effective gap size. If one would like to derive the combined ThAr/FP wavelength solution, one would have to construct a model for the effective gap from the individual Deff measurements and then evaluate this model to get the wavelengths at every position on the detector. However, for the purpose of this study, this is not necessary. We simply used the Deff(t, λ) measurements provided by the individual thorium lines and analyzed their temporal behavior. Therefore, we do not have to invoke any specific model for the Fabry-Pérot effective gap size and can treat all measurements as formally independent.
3 Chromatic FP Drift
The dataset described above contains nearly four million Deff(t, λ) measurements. To make the analysis and visualization more straightforward, we binned the data according to wavelength and time. For this purpose, we combined all measurements that correspond to the same thorium line, which results in 407 wavelength bins of unequal size. In addition, we combine data in time to blocks of two days length. We applied uniform weights to the Deff measurements contributing to a single bin.
The largest variation in the Deff(t, λ) measurements stems from the wavelength-dependent change of the Fabry-Pérot cavity length and it is much larger than the expected chromatic drift. Thus, we decomposed the Deff(t, λ) measurements according to the concepts presented in Sect. 1 into the following terms:
 (2)
(2)
Here,  represents the mean effective cavity length as function of wavelength and is obtained by averaging all measurements over time
 (3)
(3)
The temporal but achromatic drift is described by ∆Deff(t), which is computed by first subtracting the mean spectral dependence from the datapoints and then averaging over wavelength:
 (4)
(4)
The remaining term R(t, λ) contains all residuals that are not captured by the wavelength- and time-dependent variations alone. Therefore, it is representative of the chromatic component of the Fabry-Pérot drift.
Our characterization of the Espresso Fabry-Pérot is visualized in Fig. 1. The top panel shows the average effective gap size Deff (λ) as function of wavelength. Here, we have absorbed the factor 2 and the index of refraction4 given in Eq. (1) as well as some potential geometric factor in the  quantity5. The geometric spacing of the Espresso etalon is therefore only half of the shown Deff ≈ 15.210 mm and the wavelengths of individual Fabry-Pérot modes are simply
  .
.
The quantity shown in the top panel of Fig. 1 is, in principle, equivalent to the Deff(λ) presented in Fig. 11 of Schmidt et al. (2021). The apparent discrepancy results from a different choice for the Fabry-Pérot line indices. The measured Deff value depends on the index that one assigns to a given line. However, the absolute value of this index is not uniquely defined, particularly when the effective gap varies substantially with wavelength. In consequence, also the value of Deff is ambiguous. For the studies presented here and in Schmidt et al. (2021), different data reduction codes were used which implement different choices for the line index, resulting in a global offset in k and, therefore, a slightly different value of Deff. However, this is of no relevance in practice as long as a consistent combination of indexing and effective gap descriptions is used (see e.g., Bauer et al. 2015).
The right panel of Fig. 1 shows the achromatic component of the drift ∆Deff(t) as a function of time. Most obvious is the eight-month long gap of this time series in Summer 2020 caused by the closure of the observatory. After the ramp-up of Espresso in November 2020, the Fabry-Pérot interferometer did not return to the same state it was before the shutdown but settled to an effective gap that is ≈20Å smaller6. We fit a linear function to the ∆Deff(t) data obtained before the shutdown and determined a drift of −2.5 cm s−1 d−1. In 2021, this drift seems to continue, although with the stated offset. The right panel of Fig. 1 also shows several excursion from this general trend. Some of these correspond to known interventions to the instrument, indicated by horizontal red lines. Most notably, the full Espresso fiber feed was replaced in July 2019 and there were several changes of the light source illuminating the Fabry-Pérot interferometer in November and December 2020. The sharp spike in December 2019 corresponds to an anomaly of temperature and pressure in the Fabry-Pérot vacuum vessel.
The central panel of Fig. 1 shows the residuals R(t, λ) obtained by subtracting the mean spectral and mean temporal behavior from the initial Deff(t, λ) measurements. This residual variation of the Fabry-Pérot gap size has been converted to a velocity, the quantity commonly used within the context of radial-velocity studies. As stated above, there is a significant offset between the measurements taken before and after the shutdown, however, subtracting the achromatic drift captures basically all of this, allowing us to visualize and analyze the residuals for the whole available period without having to deal with any strong discontinuity. As described in Sect. 2, our characterization of the Fabry-Pérot is based on the thorium lines and not all of them are perfectly well behaved. This leads to some vertical striping in the central panel of Fig. 1 and to a few columns with particular high noise, predominantly towards the ends of the spectral range. However, despite these systematics, the global trend and in particular a clear chromatic drift of the Espresso Fabry-Pérot is easily visible. The most-noticeable features in Fig. 1 are large-scale coherent structures, corresponding to a drift that depends on wavelength. This can be seen around 6000 Å where we find a residual that evolves from +10 m s−1 to −9 m s−1 over the course of 2.5 yr. At ≈5000 Å, however, we find a drift with the opposite sign evolving from −9 m s−1 to + 8 m s−1. At wavelengths shorter than 4200 Å, this becomes a negative drift again.
In the top panel of Fig. 2, we show the residual drift versus time for a few representative wavelengths. Since the achromatic drift ∆Deff(t) is already subtracted, any significant deviation from zero is a clear indication for a chromatic drift. The drifts at the different wavelengths clearly do not follow a linear relation and the absolute value of the drift rates seems to be larger at earlier times. Nevertheless, we fit straight lines to the data to get an approximate estimate of the magnitude of the chromatic drift. We find values between −1.7 cm s−1 d−1 at 6100 Å and + 1.25 cm s−1 d−1 at 5200 Å. However, there is no simple (e.g., monotonic) relation between wavelength and drift rates. The bottom panel of Fig. 2 essentially shows the same, but in terms of absolute drift rates, namely, without subtracting the achromatic drift.
To further visualize the dependence on wavelength, we show in Fig. 3 the difference of the effective gap size between the beginning and end of our timeseries as function of wavelength. For this, we combine all R(t, λ) measurements from two 16 day long time periods (2021-04-29 ±8 days and 2018-11-11 ±8 days) and compute the difference over this 900 day timebase. Figure 3 clearly shows a quasi-oscillatory pattern for the chromatic drift as function of wavelength. The pattern is not strictly periodic but exhibits some wave-like pattern. The variation, however, is slow and we see over nearly a full octave in wavelength (or frequency) just a bit more than one period.
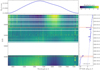 |
Fig. 1 Characterization of the Espresso Fabry-Pérot effective gap size as function of time and wavelength, decomposed as described in Eq. (2). Top panel: just the wavelength dependence of the cavity length Deff (λ) obtained by time-averaging all measurements. Right panel: achromatic drift ∆Deff(t) as function of time. A linear trend was fitted for the period before the shutdown in March 2020. The central panel shows the residual variation of the Deff(t, λ) measurements after subtraction the average spectral shape and the achromatic drift. The values are expressed as velocity shift. Horizontal red lines correspond to interventions to the system. |
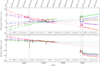 |
Fig. 2 Chromatic drift of the Espresso Fabry-Pérot for five representative wavelengths. The curves in the top panel show averages of the measurements displayed in the central panel of Fig. 1 obtained in ±4% wide spectral ranges around the stated wavelengths. Linear slopes were fitted to the data to provide a coarse estimate of the chromatic drift rates. The bottom panel shows essentially the same data, however, without subtracting the achromatic drift. Linear slopes were only fitted to epochs before the shutdown. |
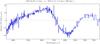 |
Fig. 3 Wavelength dependence of the chromatic drift of the Espresso Fabry-Pérot etalon over a period of 900 days. The achromatic drift ∆Deff (t) has already been subtracted. |
4 Interpretation of the Data
In principle, the observed drift could be caused by effects unrelated to the Fabry-Pérot interferometer. There are other aspects in the setup, such as the spectrograph itself or the illumination of the etalon, that might as well have an impact on the observed line positions and therefore the inferred Deff(t, λ). However, we are convinced that these do not dominate our measurement and that the observed chromatic drift is indeed caused by the Fabry-Pérot interferometer. In the following, we discuss several possibilities and explain why these parasitic effects cannot be the dominant source of the observed chromatic drift.
The best argument to rule out the spectrograph as a source for the observed drift is the absence of any discontinuity around 5200 Å. The Espresso spectrograph is composed of two arms, both equipped with independent transfer collimators, cross-dispersers, cameras, and detectors (see Pepe et al. 2021). The dichroic splits the light around 5200 Å. Still, Fig. 1 shows only slightly higher noise but no discontinuity in this region and the large-scale pattern of the chromatic drift is fully consistent and continuous across both arms. Therefore, a slow change of the spectrograph optical properties seems unlikely. Also, the Fabry-Pérot and thorium-argon spectra are taken immediately after each other and there is no reason why these should exhibit the smooth evolution with time. Therefore, a relative drift of the spectrograph can be excluded as well. In principle, a slow change of the spectrograph’s line-spread function could induce an apparent drift between Fabry-Pérot and thorium-argon spectrum since the intrinsic linewidth of both sources is substantially different. However, it is not plausible that such an effect causes the observed pattern and, in particular, that it would happen in the same way for both arms. In addition, we checked whether the beat pattern noise described in Schmidt et al. (2021) could have a relevant impact. It was determined that this systematic displacement of spectral lines remains extremely stable over timescales of months and years and does not influence the measurement of the chromatic drift in a significant way. Also, we find no evidence for possible parasitic Fabry-Pérot effects. Furthermore, we confirm that both fibers of the spectrograph (science and sky fiber) deliver consistent results for the drift measurement.
Also, we excluded a possible shift of the thorium lines utilized for characterization of the Fabry-Pérot interferometer as possible source of the observed chromatic drift. Most of all, Nave et al. (2018) report that the wavelengths of the thorium lines are robust against changes of the pressure inside the lamp and, therefore, they should not exhibit shifts due to aging of the hollow cathode lamp. Even if this were the case, the properties of the observed Fabry-Pérot drift are not consistent with a possible shift of the thorium lines. This can be seen in Fig. 3. Each step in the shown function corresponds to the drift derived from one individual thorium line. Clearly, there are some outliers. However, it seems highly unlikely that the coherent, large-scale quasi-oscillatory pattern could be caused by a intrinsic shift of the thorium lines.
Another reason for an apparent chromatic drift that is not directly related to the Fabry-Pérot etalon could be a changing spectral energy distribution (SED) of the illuminating light source. A slope in the continuum illuminating the Fabry-Pérot interferometer can lead to an offset in the fitted line centroid. With increasing age of the light source, this might change and induce an apparent drift. We analyze the evolution of the Fabry-Pérot spectral energy distribution and indeed find significant changes over the 2.5 yr period. However, these do not correlate with the observed pattern of the chromatic drift. Also, we determine that the slopes might introduce shifts of up to 10 cm s−1 but these remain stable at the few cm s−1 level over most of the 2.5 yr period and they are, therefore, a few orders of magnitude smaller than the observed chromatic drift.
A rather noticeable feature, however, appears in November and December 2020 with rapid, chromatic drifts up to 5 m s−1 (Figs. 1 and 2). This is related to several changes of the lamp illuminating the Fabry-Pérot interferometer. On November 27, the existing light source, an Energetiq laser-driven light source EQ-99X, which did show some wear at this point, was replaced by a supercontinuum source that in general should exhibit less degradation over time. However, this change of lamps had a negative impact on the quality of the wavelength calibration. In particular the beat pattern noise (Schmidt et al. 2021) increased substantially by about 30%. The new light source had a different spectral energy distribution than the old one and is coupled to a monomode instead of a multimode optical fiber, but there is no fully plausible explanation why this would cause the issues encountered in the wavelength calibration. In any case, the problem was solved by switching back to the original lamp on December 17. Another lamp change happened on December 23 when the existing lamp was replaced by a newer spare item of the same type. These changes to the Fabry-Pérot light source did have an influence on the measured chromatic drift and rather strong deviations from the overall pattern are visible in Figs. 1 and 2 around these dates. We confirm that the different spectral energy distribution of the light sources cannot be exclusively responsible for the chromatic drifts observed here. Therefore, further effects must be at play that could not be determined in detail. We have to conclude that the spectrum of the Fabry-Pérot device cannot be assumed to be stable when the light source and therefore the illumination of the etalon is changed. It therefore seems advisable to limit intervention and modifications of these parts of the setup as much as possible.
Apart from the events associated with the change of the light sources in November and December 2020, we can exclude unrelated effects and conclude that with high certainty the observed chromatic drift stems indeed from the Fabry-Pérot etalon itself. The most-plausible explanation for this is an aging of the dielectric mirror coatings. These are the only component in the setup that can introduce a strong chromatic effect.
Unfortunately, the exact layer properties of the dielectric stack for the Espresso etalon mirror coatings are not available. Therefore, it is not possible to perform a quantitative modeling and determine how aging affects the measured effective gap size. In general, we can imagine several ways by which the coatings might evolve over time. One possibility is that during manufacturing, water vapor was trapped in the dielectric layers. The Espresso Fabry-Pérot uses “soft coatings”, which are somewhat porous and known for trapping volatiles. Under vacuum conditions, the trapped water would evaporate, lead to a change of the index of refraction, and, therefore, to a change of the etalon effective spacing. Figure 2 indeed shows the fastest drift rates at the beginning of regular operations in 2018, but this was already about one year after installment of Espresso at Paranal. Figure 2 also shows that even after years of operation under vacuum conditions, the drift continues with no asymptotic state in sight. It seems not very likely that an outgassing process, as described above, would persist for such long periods of time. Therefore, other processes are probably involved as well. With the data at hand, it is not possible to determine the root cause of the observed chromatic drift and further studies are required.
5 Comparison with the HPF Faby-Pérot
Chromatic drift of a Fabry-Pérot interferometer used as calibration source for an astronomical spectrograph was first reported by Terrien et al. (2021). In this section, we aim to briefly compare the results of our analysis of the Espresso Fabry-Pérot interferometer with those presented by Terrien et al. (2021) of the one installed at the HPF spectrograph.
It has to be stressed that both instruments have several important differences. The HPF spectrographs and its corresponding Fabry-Pérot interferometer operates in the near infrared between 8200 and 12 800 Å, roughly covering the z, y, and J bands, while Espresso is sensitive in the visible domain between 3800 and 7900 Å. More importantly, the HPF Fabry-Pérot etalon is designed with a high finesse of  to achieve a small intrinsic linewidth (≈800MHz or ≈0.85 km s−1), substantially narrower than the instrumental resolution (Jennings et al. 2020). The Espresso Fabry-Pérot etalon, however, has a lower finesse of
  and the Fabry-Pérot lines are clearly resolved and appear about 20% wider than the intrinsic linewidth. Therefore, the mirrors in the HPF etalon have a much higher reflectivity (≈90%) than the Espresso ones (≈76%). In addition, the HPF etalon is fed by monomode fibers from a NKT SuperK super-continuum lights ource while the Espresso one uses multimode fibers and is illuminated by an Energetiq laser-driven light source EQ-99X. Therefore, the Espresso and HPF Fabry-Pérot interferometers do follow the same underlying idea but exhibit quite substantial differences in how this basic concept is implemented in practice.
Nevertheless, we find overall quite similar results as do Terrien et al. (2021). They report an achromatic bulk drift of their Fabry-Pérot interferometer of ≈ −2 cm s−1 d−1, while we find a value of −2.6 cm s−1 d−1 for Espresso (see Fig. 1). Also the amplitude of the chromatic drift is similar. Terrien et al. (2021) report, depending on the wavelength, drifts between −7 and +3 cm s−1 d−1 when not subtracting the bulk drift. We find values between −2.2 and +1.6 cm s−1 d−1 after correcting for the achromatic drift (see Figs. 2 and 37) and equivalently absolute drift rates between −5.6 and −0.2 cm s−1 d−1 determined over a 450 day period before the shutdown. Although the Espresso chromatic drift is a bit smaller, this is a striking resemblance, given the rather different designs of the two Fabry-Pérot devices.
The most informative aspect is probably a comparison of the drift rate as function of wavelength. This is presented in Fig. 7 in Terrien et al. (2021) and here in Fig. 3. The HPF etalon shows a clear oscillatory pattern with a period that significantly increases with wavelength. Over the presented wavelength range from 8200 to 12 800 Å, six oscillations can be seen. For Espresso, the situation is less clear and we just find a quasi-oscillatory pattern. Despite the larger (relative) spectral range covered by our study, Fig. 3 only shows one clear oscillation and some aperiodic behavior bluewards of 5000 Å. In this sense, the two Fabry-Pérot etalons show quite different behaviors. On the other hand, we have to consider that the dielectric coatings on both of them have to be substantially different, achieving quite different reflectivity over different spectral ranges. Therefore, it is worth highlighting the similarity, namely, the appearance of a (quasi-)oscillatory pattern, rather than the differences in detail.
Based on these similarities, we think that we basically observe the same effect for both Fabry-Pérot interferometers and that the chromatic drift is related to an aging of the dielectric coatings. Also, it appears that chromatic drifts are probably a very common feature of Fabry-Pérot interferometers that quite likely affects all such devices used in astronomy. The magnitude of the effect, namely, of a few cm s−1 per day, is not dramatic, which explains why it could be easily overlooked in previous studies. Nevertheless, it will accumulate over longer periods. An uncorrected chromatic drift of the Fabry-Pérot interferometer will cause radial velocities from different spectral ranges to become inconsistent with each other. Tests on standard stars reveal that this effect can actually be observed on-sky. Radial velocities extracted from different spectral regions do indeed show a differential drift that is broadly consistent with the inverse of the Fabry-Pérot chromatic drift we present in this study. It still has to be determined to which degree additional effects such as variable seeing and wavelength-dependent fiber injection losses then lead to an overall impact on the measured radial velocity. Nevertheless, this highlights the importance to correct for the chromatic drift of the Fabry-Pérot interferometer when aiming for extreme-precision radial-velocity measurements.
Fortunately, this should be possible without major difficulties. In this study, we clearly demonstrate that the chromatic drift of the Espresso Fabry-Pérot interferometer can be adequately measured and characterized using the standard thorium-argon exposures. In addition, we show that the chromatic drift is well-behaved in the sense that it mostly affects the larges spectral and temporal scales. Therefore, it seems feasible to measure and correct for the chromatic drift as part of the routine wavelength calibration process without requiring any special calibration exposures. Efforts to implement such a correction for the Espresso Data Reduction System are underway.
6 Conclusions
In this study, we present a systematic analysis of the Espresso Fabry-Pérot interferometer. We use calibration data from 1658 epochs spread over 2.5 yr from November 2018 to May 2021, but excluding eight months in mid-2020. Our analysis is based on the absolute wavelength information provided by the standard thorium-argon calibration spectra, which deliver 2300 measurements of the Fabry-Pérot effective gap size per epoch, derived from 407 unique thorium lines.
We decomposed these nearly four million Deff(t, λ) measurements in a purely wavelength-dependent variation of the effective gap size  , an achromatic time-evolution ∆Deff(t), and a residual component R(t, λ) that reflects the chromatic drift of the Fabry-Pérot interferometer. We find in these residuals clear, large-scale structure with an amplitude of up to 10 m s−1 (see Fig. 1). There is no simple (i.e., monotonic) relation between wavelength and chromatic drift, instead we find positive as well as negative drift rates with an amplitude of up to 2.2 cm s−1 d−1, which is comparable with the achromatic drift of −2.6 cm s−1 d−1 (Fig. 2). As a function of wavelength, the chromatic drift of the Espresso Fabry-Pérot etalon exhibits a wave-like, quasi-oscillatory pattern, however, with less than two periods over the full spectral range (Fig. 3).
After checking and ruling out other possible causes, we confirm that the observed chromatic drift is indeed related to the etalon itself. The most probable reason is an aging of the dielectric multi-layer coatings on the etalon mirrors. However, the exact mechanism behind this could no be determined and further studies and simulations are required to figure out the root cause.
We compare our results with the findings of Terrien et al. (2021) who recently reported a chromatic drift of the Fabry-Pérot interferometer installed at the Habitable-zone Planet Finder (HPF) spectrograph. Overall, we find very similar effects, despite a rather different design of the Fabry-Pérot devices (see Sect. 5). We therefore conclude that chromatic drifts are a very common phenomenon that probably affects every Fabry-Pérot interferometer installed at astronomical spectrographs. This also has implications for actively stabilized Fabry-Pérot interferometers. At this point, it would be necessary to investigate whether a stabilization at a single wavelength (as e.g., in Stürmer et al. 2017) actually provides a significantly better wavelength calibration than no active stabilization at all.
Fortunately, as demonstrated within our study, it is possible to measure and characterize the chromatic drift of the Fabry-Pérot interferometer using solely the standard thorium-argon spectra without the need of a special calibration source, such as a laser frequency comb. Therefore, it also should be possible to include a correction of the Fabry-Pérot chromatic drift in the routine wavelength calibration procedures of any high-resolution echelle spectrograph.
Acknowledgements
The authors thank the anonymous referee for helpful comments. This research has made use of Astropy, a community-developed core Python package for Astronomy (Astropy Collaboration 2013, 2018), and Matplotlib (Hunter 2007). This publication makes use of the Data & Analysis Center for Exoplanets (DACE), which is a facility based at the University of Geneva (CH) dedicated to extrasolar planets data visualization, exchange and analysis. DACE is a platform of the Swiss National Centre of Competence in Research (NCCR) PlanetS, federating the Swiss expertise in Exoplanet research. TMS acknowledgment the support from the SNF synergia grant CRSII5-193689 (BLUVES). XD received funding from the European Research Council (ERC) under the European Union’s Horizon 2020 research and innovation programme (grant agreement No 851555/SCORE). This work has been carried out within the framework of the National Centre of Competence in Research PlanetS supported by the Swiss National Science Foundation.
References
- Astropy Collaboration (Robitaille, T.P., et al.) 2013, A&A, 558, A33 [NASA ADS] [CrossRef] [EDP Sciences] [Google Scholar]
- Astropy Collaboration (Price-Whelan, A.M., et al.) 2018, AJ, 156, 123 [NASA ADS] [CrossRef] [Google Scholar]
- Bauer, F.F., Zechmeister, M., & Reiners, A. 2015, A&A, 581, A117 [NASA ADS] [CrossRef] [EDP Sciences] [Google Scholar]
- Cersullo, F., Coffinet, A., Chazelas, B., Lovis, C., & Pepe, F. 2019, A&A, 624, A122 [NASA ADS] [CrossRef] [EDP Sciences] [Google Scholar]
- Hao, J., Tang, L., Ye, H., et al. 2021, AJ, 161, 258 [NASA ADS] [CrossRef] [Google Scholar]
- Hobson, M.J., Bouchy, F., Cook, N.J., et al. 2021, A&A, 648, A48 [NASA ADS] [CrossRef] [EDP Sciences] [Google Scholar]
- Hunter, J.D. 2007, Comput. Sci. Eng., 9, 90 [NASA ADS] [CrossRef] [Google Scholar]
- Jennings, J., Terrien, R., Fredrick, C., et al. 2020, OSA Continuum, 3, 1177 [CrossRef] [Google Scholar]
- Mahadevan, S., Ramsey, L.W., Terrien, R., et al. 2014, SPIE Conf. Ser., 9147, 91471G [NASA ADS] [Google Scholar]
- Mayor, M., & Queloz, D. 1995, Nature, 378, 355 [NASA ADS] [CrossRef] [Google Scholar]
- Mégevand, D., Zerbi, F.M., Di Marcantonio, P., et al. 2014, SPIE Conf. Ser., 9147, 91471H [Google Scholar]
- Metcalf, A.J., Anderson, T., Bender, C.F., et al. 2019a, Optica, 6, 233 [NASA ADS] [CrossRef] [Google Scholar]
- Metcalf, A.J., Fredrick, C.D., Terrien, R.C., Papp, S.B., & Diddams, S.A. 2019b, Opt. Lett., 44, 2673 [CrossRef] [Google Scholar]
- Molaro, P. 2009, Astrophys. Space Sci. Proc., 9, 389 [NASA ADS] [CrossRef] [Google Scholar]
- Murphy, M.T., Molaro, P., Leite, A.C.O., et al. 2022, A&A, 658, A123 [NASA ADS] [CrossRef] [EDP Sciences] [Google Scholar]
- Nave, G., Kerber, F., Den Hartog, E.A., & Lo Curto, G. 2018, SPIE Conf. Ser., 10704, 1070407 [NASA ADS] [Google Scholar]
- Pepe, F.A., Cristiani, S., Rebolo Lopez, R., et al. 2010, SPIE Conf. Ser., 7735, 77350F [NASA ADS] [Google Scholar]
- Pepe, F., Molaro, P., Cristiani, S., et al. 2014, Astron. Nachr., 335, 8 [NASA ADS] [CrossRef] [Google Scholar]
- Pepe, F., Cristiani, S., Rebolo, R., et al. 2021, A&A, 645, A96 [NASA ADS] [CrossRef] [EDP Sciences] [Google Scholar]
- Perot, A., & Fabry, C. 1899, ApJ, 9, 87 [NASA ADS] [CrossRef] [Google Scholar]
- Probst, R.A., Lo Curto, G., Avila, G., et al. 2014, SPIE Conf. Ser., 9147, 91471C [NASA ADS] [Google Scholar]
- Probst, R.A., Lo Curto, G., Avila, G., et al. 2016, SPIE Conf. Ser., 9908, 990864 [NASA ADS] [Google Scholar]
- Sandage, A., Véron, P., & Wyndham, J.D. 1965, ApJ, 142, 1307 [NASA ADS] [CrossRef] [Google Scholar]
- Schmidt, T.M., Molaro, P., Murphy, M.T., et al. 2021, A&A, 646, A144 [NASA ADS] [CrossRef] [EDP Sciences] [Google Scholar]
- Seifahrt, A., Stürmer, J., Bean, J.L., & Schwab, C. 2018, SPIE Conf. Ser., 10702, 107026D [NASA ADS] [Google Scholar]
- Stürmer, J., Seifahrt, A., Schwab, C., & Bean, J.L. 2017, J. Astron. Teles. Instrum. Syst., 3, 025003 [CrossRef] [Google Scholar]
- Terrien, R.C., Ninan, J.P., Diddams, S.A., et al. 2021, AJ, 161, 252 [NASA ADS] [CrossRef] [Google Scholar]
- Webb, J.K., Flambaum, V.V., Churchill, C.W., Drinkwater, M.J., & Barrow, J.D. 1999, Phys. Rev. Lett., 82, 884 [NASA ADS] [CrossRef] [Google Scholar]
- Wildi, F., Pepe, F., Chazelas, B., Lo Curto, G., & Lovis, C. 2010, SPIE Conf. Ser., 7735, 77354X [NASA ADS] [Google Scholar]
- Wildi, F., Pepe, F., Chazelas, B., Lo Curto, G., & Lovis, C. 2011, SPIE Conf. Ser., 8151, 81511F [NASA ADS] [Google Scholar]
- Wildi, F., Chazelas, B., & Pepe, F. 2012, SPIE Conf. Ser., 8446, 84468E [NASA ADS] [Google Scholar]
For example, Cersullo et al. (2019) showed that the thorium-only wavelength solution of the HARPS spectrograph suffers from deviations on intra-order scales of up to 200 m s−1.
Although the Fabry-Pérot device is located in a vacuum vessel small changes of the residual pressure and therefore the index of refraction have a measurable effect on the output spectrum.
Some geometric corrections factor will stem from the fact that the Espresso FP is fed by a multimode fiber which has a finite extension compared to the theoretical assumption of a perfectly collimated beam produced by a point source, see e.g. Hao et al. (2021).
Also the spectrograph did not return to exactly the same configuration which manifests itself e.g. by a shift of the echellogram by several pixels.
All Figures
|
Fig. 1 Characterization of the Espresso Fabry-Pérot effective gap size as function of time and wavelength, decomposed as described in Eq. (2). Top panel: just the wavelength dependence of the cavity length Deff (λ) obtained by time-averaging all measurements. Right panel: achromatic drift ∆Deff(t) as function of time. A linear trend was fitted for the period before the shutdown in March 2020. The central panel shows the residual variation of the Deff(t, λ) measurements after subtraction the average spectral shape and the achromatic drift. The values are expressed as velocity shift. Horizontal red lines correspond to interventions to the system. |
| In the text | |
|
Fig. 2 Chromatic drift of the Espresso Fabry-Pérot for five representative wavelengths. The curves in the top panel show averages of the measurements displayed in the central panel of Fig. 1 obtained in ±4% wide spectral ranges around the stated wavelengths. Linear slopes were fitted to the data to provide a coarse estimate of the chromatic drift rates. The bottom panel shows essentially the same data, however, without subtracting the achromatic drift. Linear slopes were only fitted to epochs before the shutdown. |
| In the text | |
|
Fig. 3 Wavelength dependence of the chromatic drift of the Espresso Fabry-Pérot etalon over a period of 900 days. The achromatic drift ∆Deff (t) has already been subtracted. |
| In the text | |
Current usage metrics show cumulative count of Article Views (full-text article views including HTML views, PDF and ePub downloads, according to the available data) and Abstracts Views on Vision4Press platform.
Data correspond to usage on the plateform after 2015. The current usage metrics is available 48-96 hours after online publication and is updated daily on week days.
Initial download of the metrics may take a while.