Fig. 8
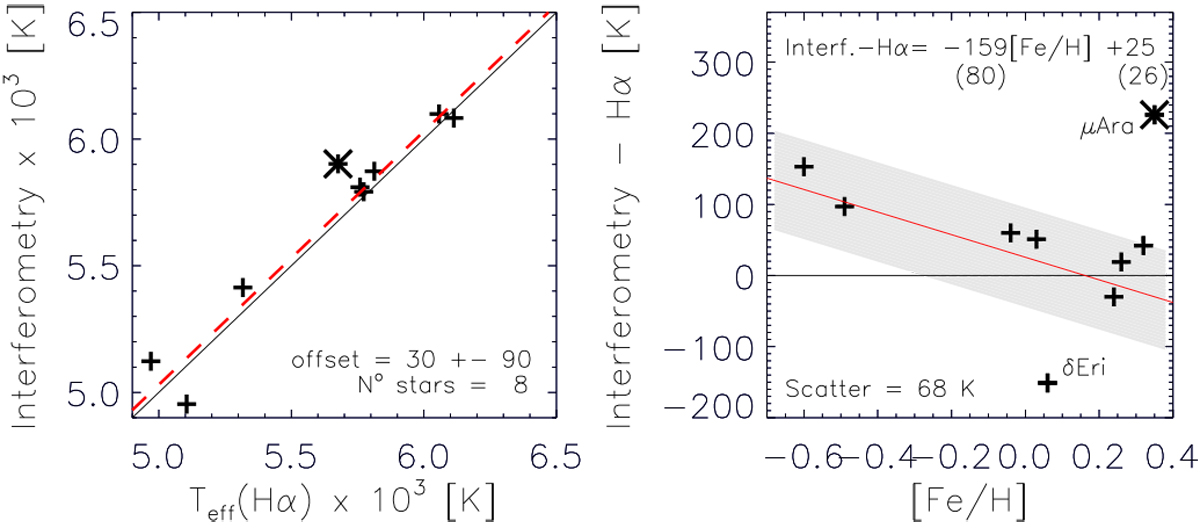
Left panel: comparison of ![]() with Teff from interferometry of the Gaia Benchmark Stars (Heiter15). The red dashed line represents the offset. Right panel: relative temperatures as a function of [Fe/H]. The red line and the shade represent the trend and its scatter. The corresponding function and the errors ofits coefficients (in brackets) are shown in the legends. The cross symbol in both plots shows data points for μ Ara (HD 160691) that are considered as outliers.
with Teff from interferometry of the Gaia Benchmark Stars (Heiter15). The red dashed line represents the offset. Right panel: relative temperatures as a function of [Fe/H]. The red line and the shade represent the trend and its scatter. The corresponding function and the errors ofits coefficients (in brackets) are shown in the legends. The cross symbol in both plots shows data points for μ Ara (HD 160691) that are considered as outliers.
Current usage metrics show cumulative count of Article Views (full-text article views including HTML views, PDF and ePub downloads, according to the available data) and Abstracts Views on Vision4Press platform.
Data correspond to usage on the plateform after 2015. The current usage metrics is available 48-96 hours after online publication and is updated daily on week days.
Initial download of the metrics may take a while.