Fig. 7
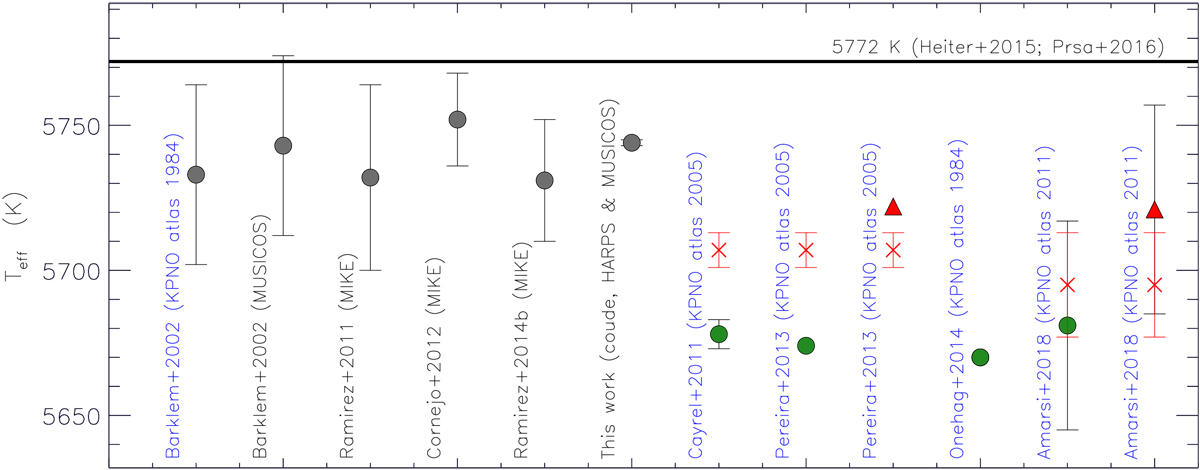
Graphic representation of solar Teff values in Table 2. The horizontal line represents the solar Teff measured by the Stefan-Boltzmann equation. Works that used theoretical models based on 1D atmosphere models are represented by circles, and those that used 3D models are represented by triangles. Grey circles represent works that used the theoretical model of BPO02, and green circles represent works that used a different/enhanced recipe. Works that used KPNO solar atlases are labelled in blue. For them, for comparison purposes, our measurements from corresponding KPNO spectra are included as red crosses in the same line.
Current usage metrics show cumulative count of Article Views (full-text article views including HTML views, PDF and ePub downloads, according to the available data) and Abstracts Views on Vision4Press platform.
Data correspond to usage on the plateform after 2015. The current usage metrics is available 48-96 hours after online publication and is updated daily on week days.
Initial download of the metrics may take a while.