Fig. 5
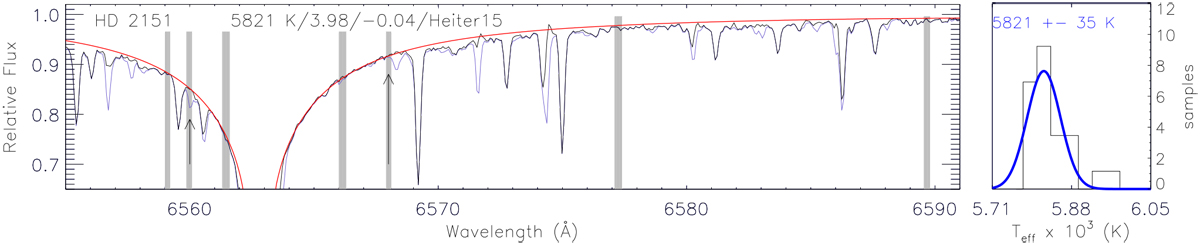
Telluric correction and profile fitting of the Coudé spectrum of HD 2151. Left panel:corrected and non-corrected spectra are represented by the black and blue lines, respectively. The windows of fits are represented by the shades, and the arrows point to those windows where the relative flux was perfectly recovered. The red line represents the fitted synthetic profile. Right panel: histogram of temperatures related to the wavelength bins inside the windows of fits. The most probable ![]() is shown in the top part of the plots, also log g and [Fe/H] values used for the fittings along with their source in the literature are shown.
is shown in the top part of the plots, also log g and [Fe/H] values used for the fittings along with their source in the literature are shown.
Current usage metrics show cumulative count of Article Views (full-text article views including HTML views, PDF and ePub downloads, according to the available data) and Abstracts Views on Vision4Press platform.
Data correspond to usage on the plateform after 2015. The current usage metrics is available 48-96 hours after online publication and is updated daily on week days.
Initial download of the metrics may take a while.