Fig. 4
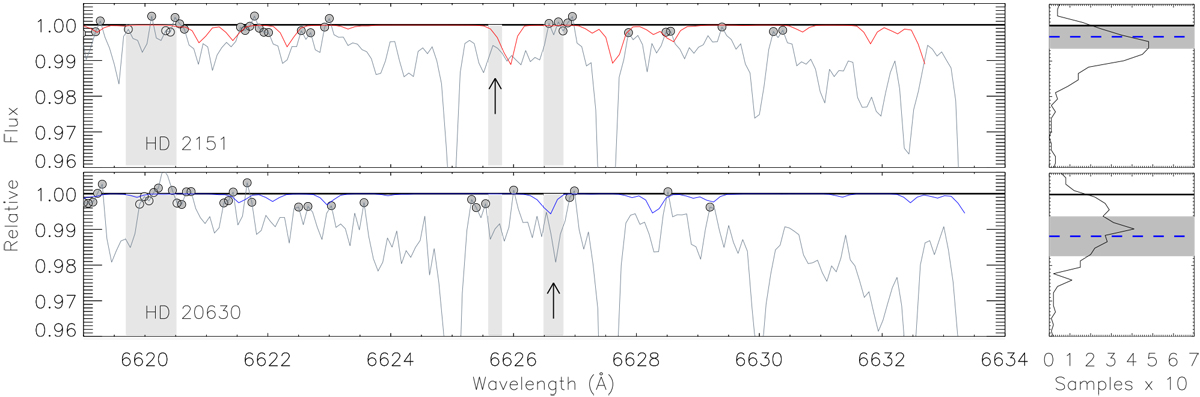
Left panels: fitting of two Coudé spectra (grey line) with synthetic spectra of PWV with concentrations of 7.5 and 5 mm (red and blue lines, respectively) for the same air mass. The circles are the continuum wavelength bins on 1 ± σ(noise). The shades represent 3 of the 5 continuum windows selected in Fig. 2. The arrows point to the windows contaminated by telluric features. Right panels: flux histograms of the spectra on the left panels with the same flux scale. The black horizontal line shows the continuum, and the dashed line is the average flux of the five continuum windows of Fig. 2 and the shades are the spread.
Current usage metrics show cumulative count of Article Views (full-text article views including HTML views, PDF and ePub downloads, according to the available data) and Abstracts Views on Vision4Press platform.
Data correspond to usage on the plateform after 2015. The current usage metrics is available 48-96 hours after online publication and is updated daily on week days.
Initial download of the metrics may take a while.