Fig. 3
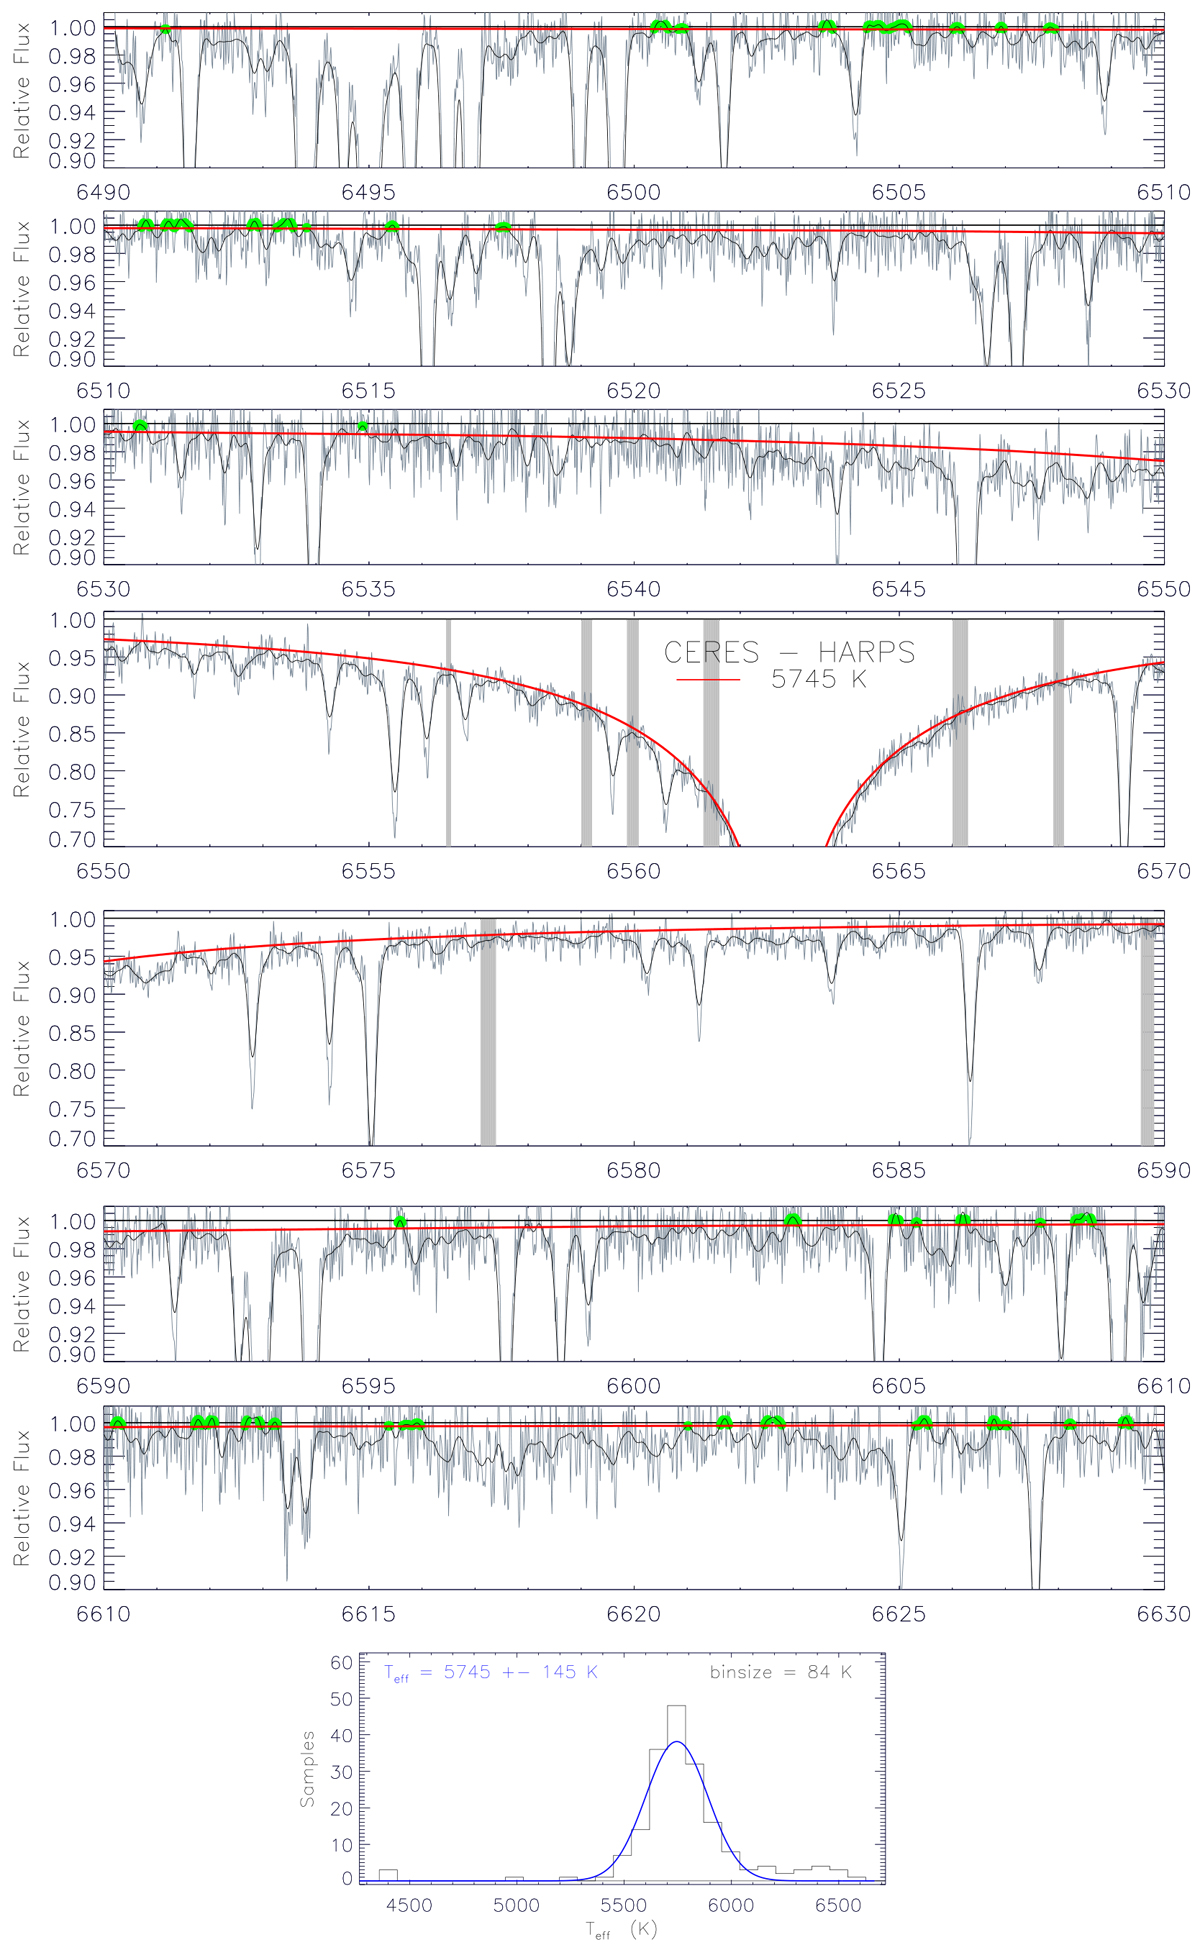
As in Fig. 2 but with a HARPS spectrum of one of the solar proxies from Table 3. The grey line represents the spectrum in its original resolution and the black line represents the spectrum degraded to the resolution of Coudé. Continuum bins in the degraded spectrum are highlighted in green; notice that they mostly match those of Fig. 2.
Current usage metrics show cumulative count of Article Views (full-text article views including HTML views, PDF and ePub downloads, according to the available data) and Abstracts Views on Vision4Press platform.
Data correspond to usage on the plateform after 2015. The current usage metrics is available 48-96 hours after online publication and is updated daily on week days.
Initial download of the metrics may take a while.