Fig. 2
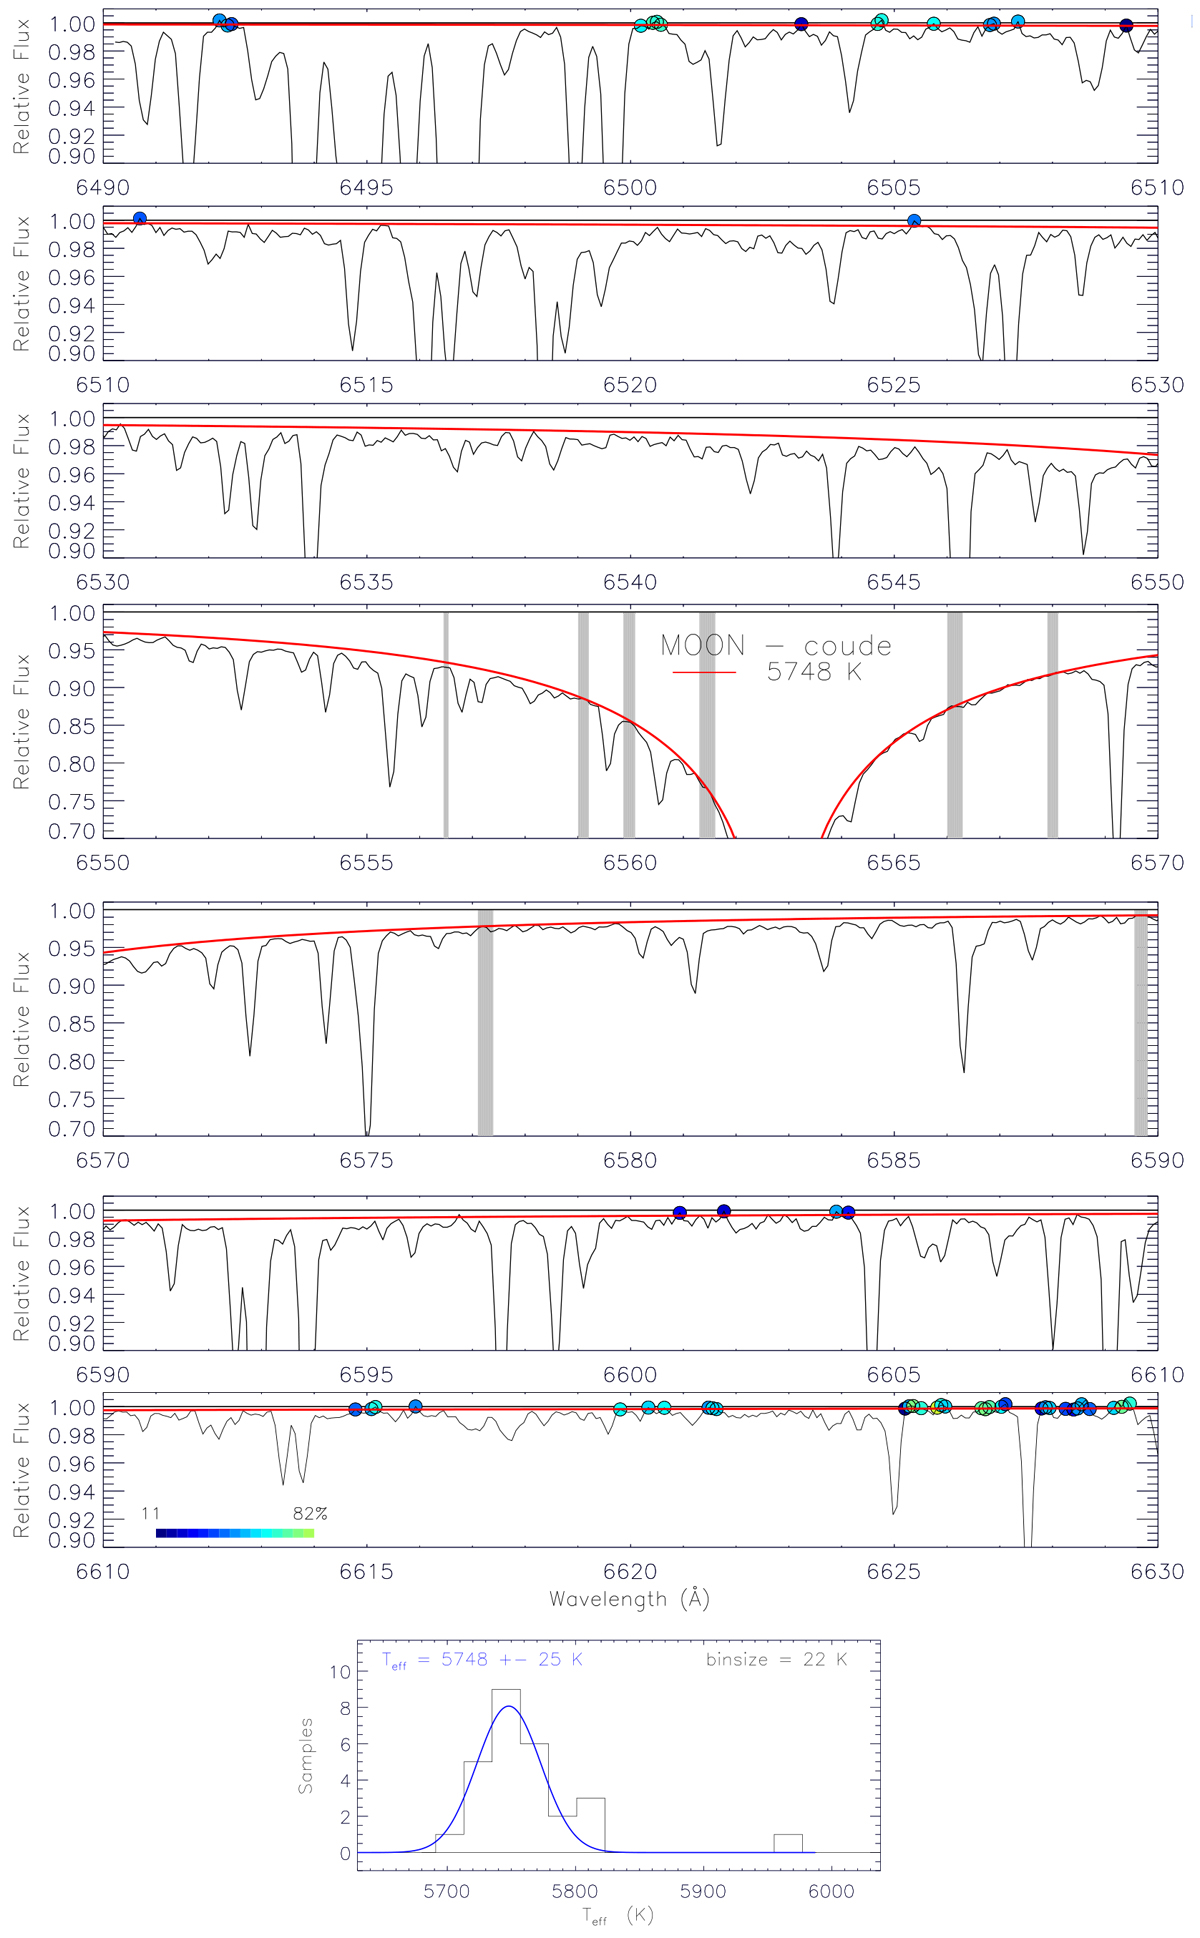
Coudé Hα profile of one of the solar proxies in Table 3. The red and black lines represent the synthetic and observed profiles. The shaded regions are the windows of fits and the circles represent the continuum bins colour-coded according to their frequency of appearance in all Coudé spectra. The most frequent continuum windows are observed at [6500.25, 6500.50], [6504.50, 6505.00], [6619.70, 6620.50], [6625.60, 6625.80] and [6626.50, 6626.80]. Bottom panel: histogram of temperatures related to the wavelength bins within the windows of fits. A Gaussian is fitted to its median and robust standard deviation.
Current usage metrics show cumulative count of Article Views (full-text article views including HTML views, PDF and ePub downloads, according to the available data) and Abstracts Views on Vision4Press platform.
Data correspond to usage on the plateform after 2015. The current usage metrics is available 48-96 hours after online publication and is updated daily on week days.
Initial download of the metrics may take a while.