Fig. 14
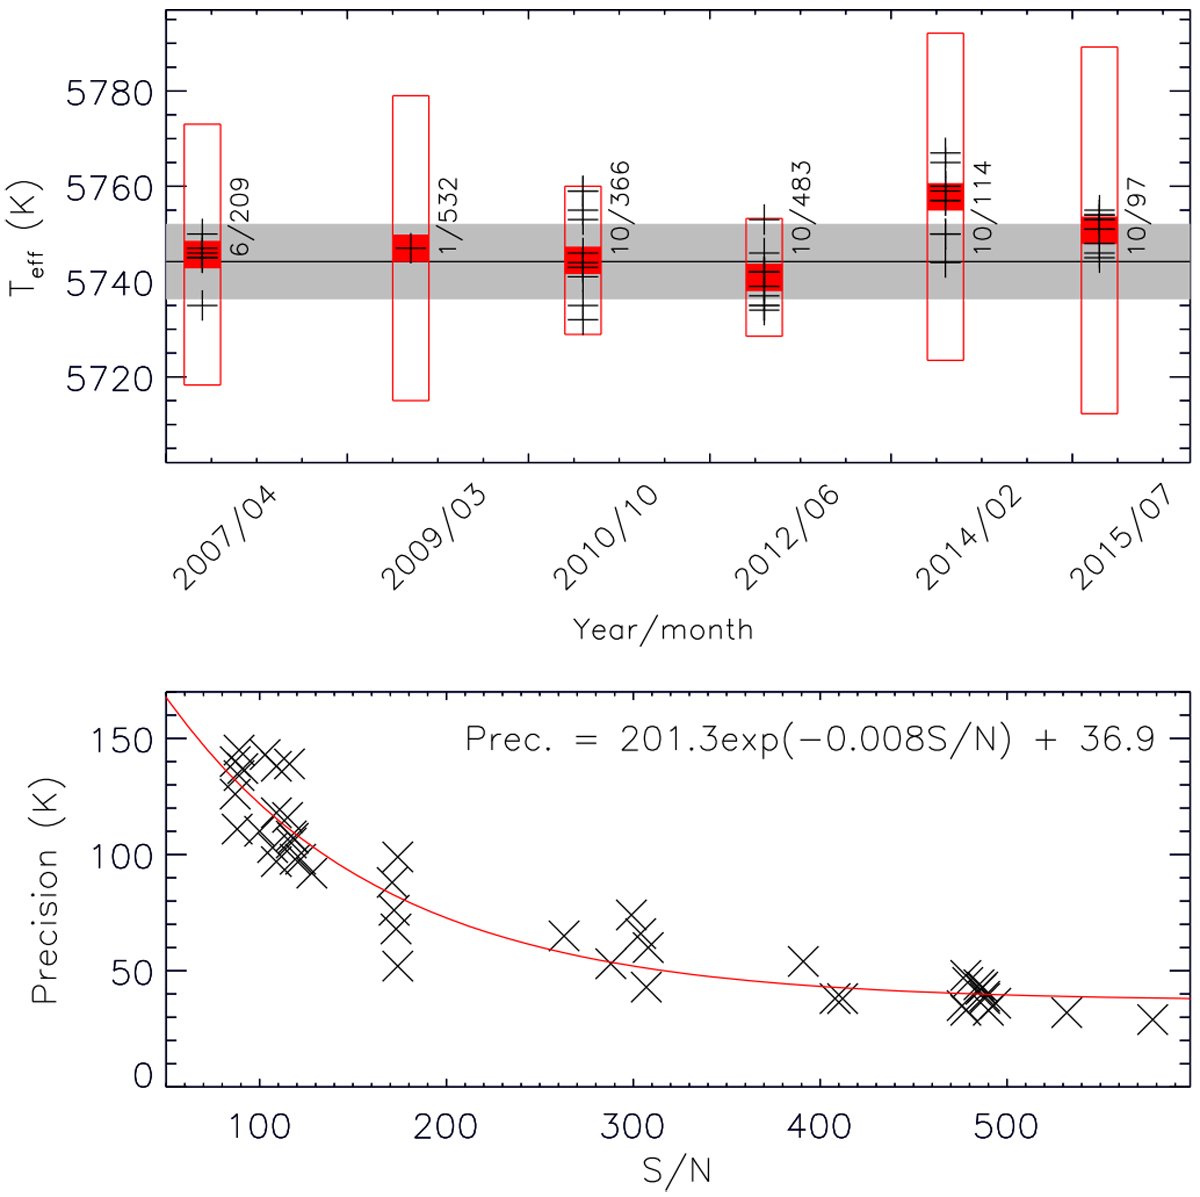
Top panel: temperatures of the HARPS solar proxies in Table 3 vs. the date upon which spectra were acquired. Daily values are represented by plus symbols and weighted means and errors for each month are drawn in red. The weighted mean and error of all the measurements are represented by the continuous line and the shade on 5744 ± 10 K. Next to the bars, the number of spectra analysed and the mean S/N are noted. Bottom panel: errors of individual measurements in the top panel are plotted vs. S/N. The exponential curve given by the equation in the plot is the best fit to the points.
Current usage metrics show cumulative count of Article Views (full-text article views including HTML views, PDF and ePub downloads, according to the available data) and Abstracts Views on Vision4Press platform.
Data correspond to usage on the plateform after 2015. The current usage metrics is available 48-96 hours after online publication and is updated daily on week days.
Initial download of the metrics may take a while.