Free Access
Fig. 12
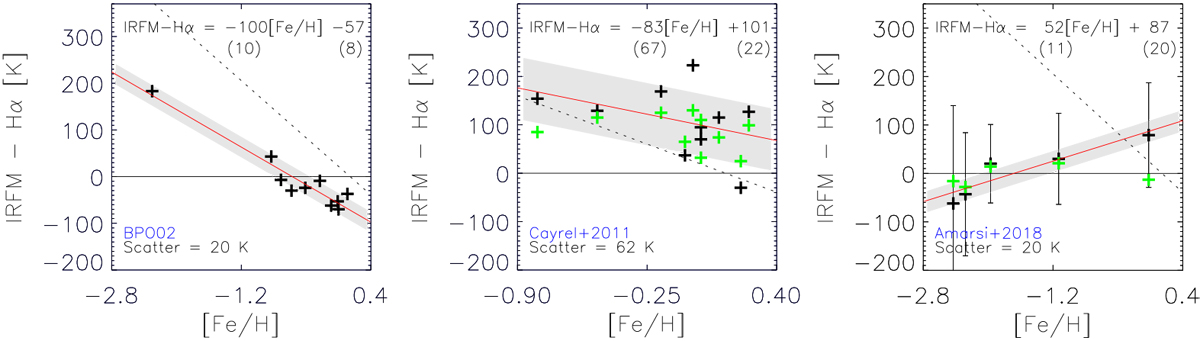
From left to right panels: analogous comparisons to the middle panel in Fig. 9 for the Hα scales of BPO02, Cayrel et al. (2011), and Amarsi et al. (2018). In all plots, for a quick comparison, the trend with [Fe/H] of Fig. 9 is represented by the dotted line. Green symbols represent interferometric Teff replacing ![]() .
.
Current usage metrics show cumulative count of Article Views (full-text article views including HTML views, PDF and ePub downloads, according to the available data) and Abstracts Views on Vision4Press platform.
Data correspond to usage on the plateform after 2015. The current usage metrics is available 48-96 hours after online publication and is updated daily on week days.
Initial download of the metrics may take a while.