Fig. 10
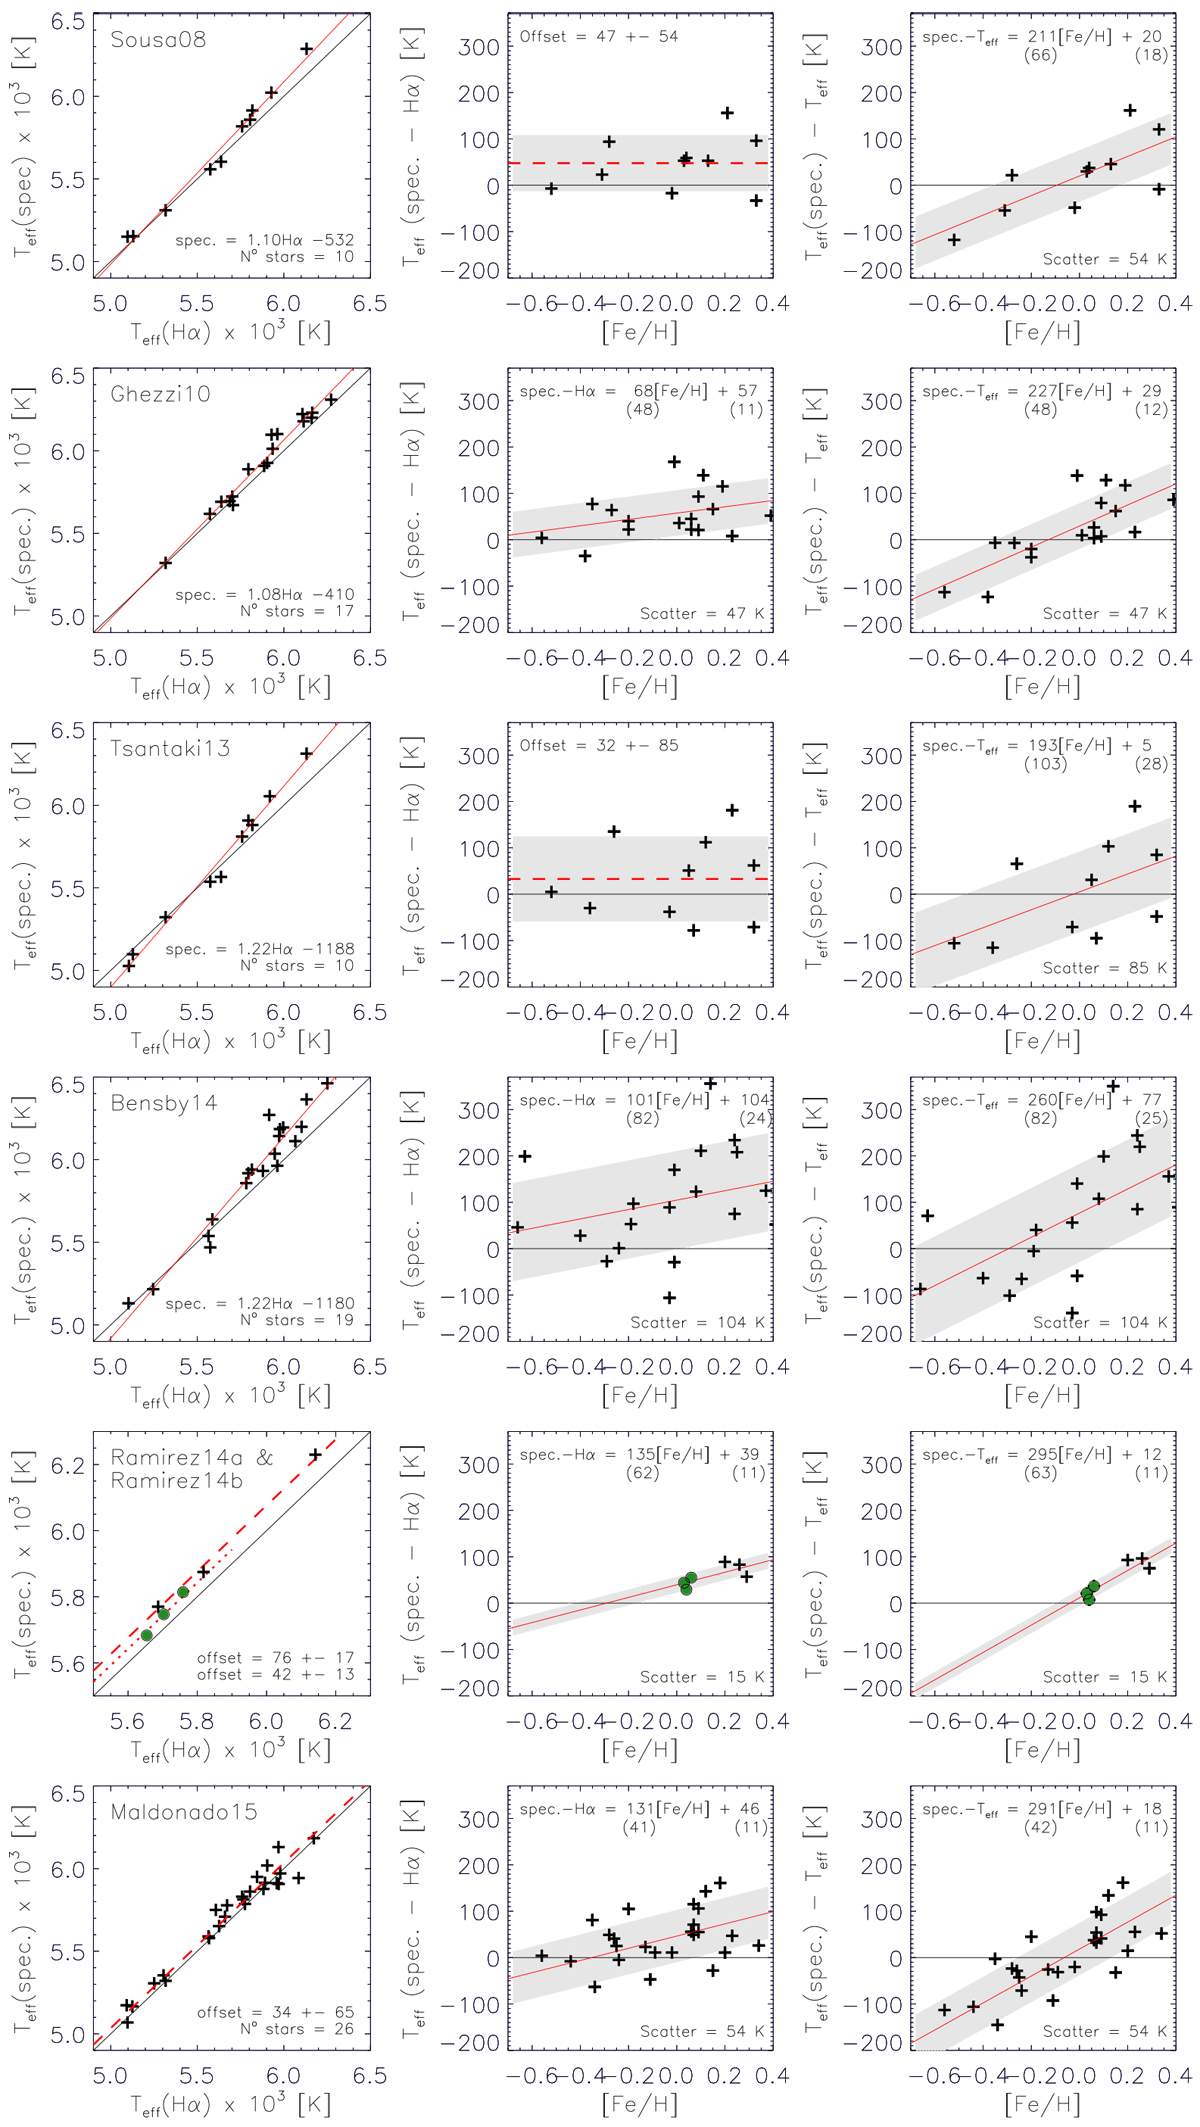
As in Fig. 9 but for spectroscopic Teff. The authors are indicated in the plots in the left panels. In all plots, the black lines represent the perfect agreement and the red lines the trends. When the trends are not significant, the offsets are drawn with dashed red lines. Teff from Ramirez14a (plus symbols) and Ramirez14b (green circles), derived with the same method, are compared in the same plots.
Current usage metrics show cumulative count of Article Views (full-text article views including HTML views, PDF and ePub downloads, according to the available data) and Abstracts Views on Vision4Press platform.
Data correspond to usage on the plateform after 2015. The current usage metrics is available 48-96 hours after online publication and is updated daily on week days.
Initial download of the metrics may take a while.