Fig. 8
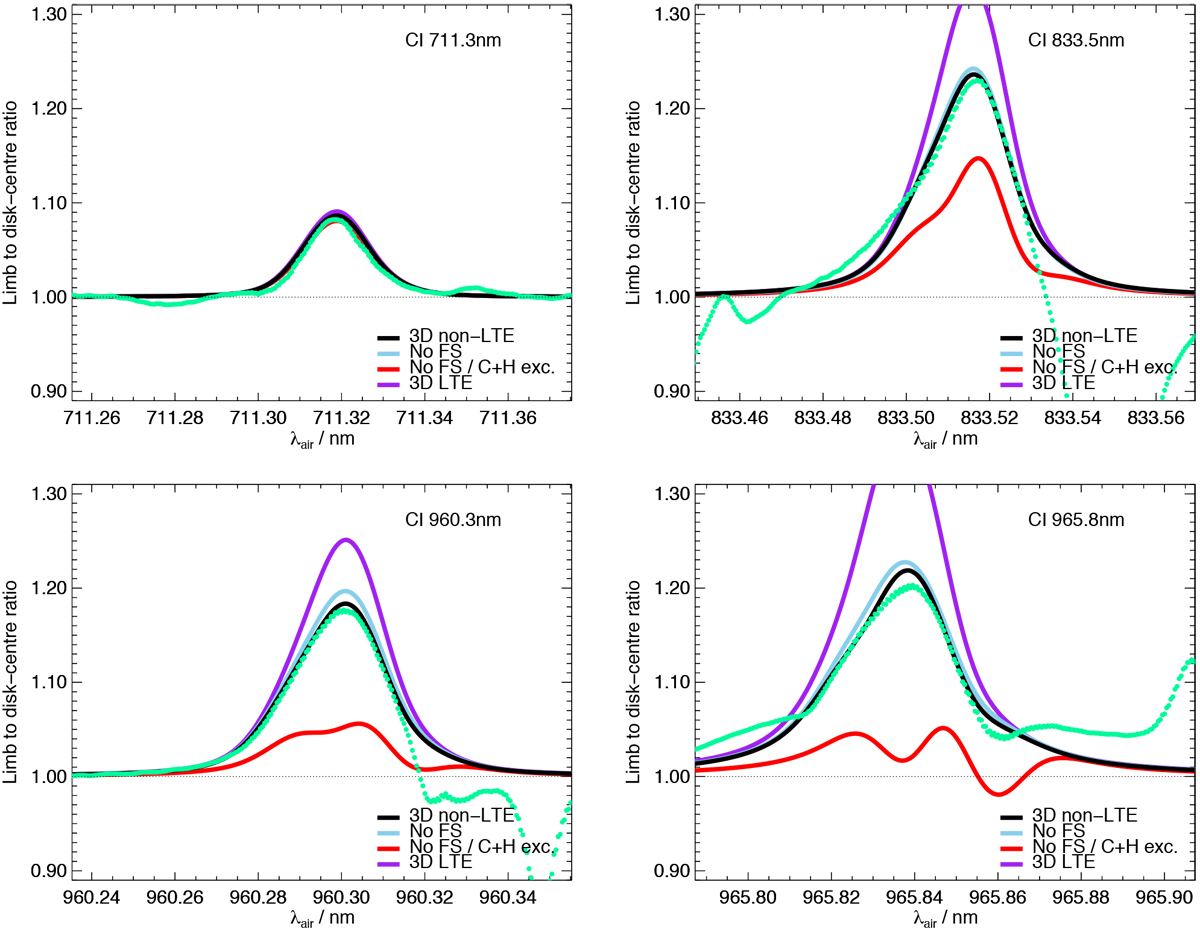
Comparison of the observed limb (μ ≈ 0.145) to disk-centre (μ = 1.0) normalised intensity ratios with different model predictions, for different lines. The solar carbon abundances were set independently for each line and model using disk-centre intensity equivalent widths. The solar carbon abundances and limb viewing angle were allowed to vary within their respective uncertainties, as described in Sect. 3.4. See also Fig. 7.
Current usage metrics show cumulative count of Article Views (full-text article views including HTML views, PDF and ePub downloads, according to the available data) and Abstracts Views on Vision4Press platform.
Data correspond to usage on the plateform after 2015. The current usage metrics is available 48-96 hours after online publication and is updated daily on week days.
Initial download of the metrics may take a while.