Fig. 5
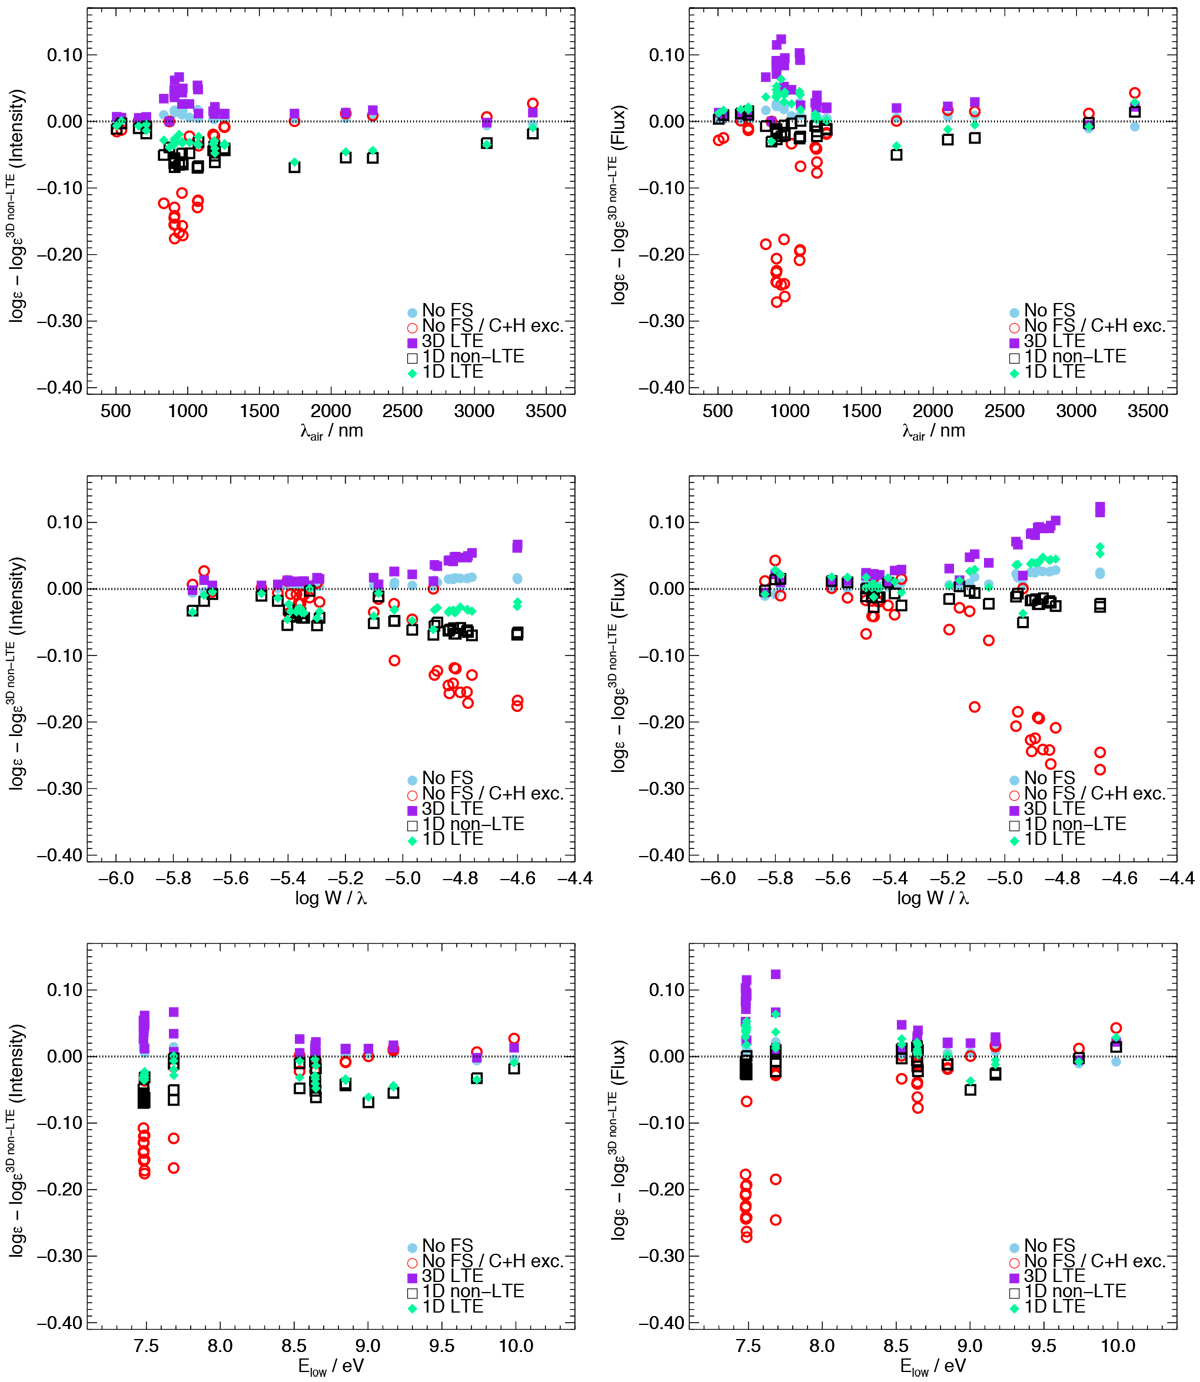
Abundance errors (i.e. abundance differences with respect to 3D non-LTE) for the lines listed in Table 1, when observed as disk-centre intensity (left column) or as disk-integrated flux (right column). The [C I] 872.7 nm line is not shown in these plots. Positive abundance errors imply negative abundance corrections. A fixed 3D non-LTE solar carbon abundance of 8.43 dex was assumed.
Current usage metrics show cumulative count of Article Views (full-text article views including HTML views, PDF and ePub downloads, according to the available data) and Abstracts Views on Vision4Press platform.
Data correspond to usage on the plateform after 2015. The current usage metrics is available 48-96 hours after online publication and is updated daily on week days.
Initial download of the metrics may take a while.